Problem Statement :
Consider a wind farm, where hundreds of wind turbines are harnessing energy from wind and storing them as energy in large cells. All these big pieces of equipment are located remote offshore and often requires engineers to travel a long distance to troubleshoot them. Leveraging IoT, Machine level data processing, and streaming can save a lot to the industry.
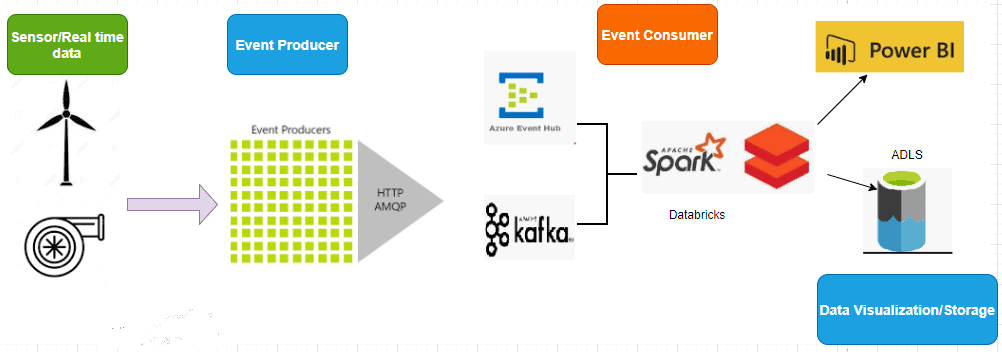
1. Preparing the data sourceThe above architecture is a prototype of industrial cloud automation using sensor data.
For the given scenario, I have created a small python application that generates dummy sensor readings to Azure Event hub/Kafka. I have used Azure Databricks for capturing the streams from the event hub and PoweBI for data Visualization of the received data.
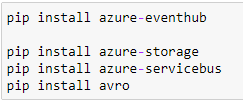
At first, create an event hub in the Azure portal and note down its namespace, access-key name, and value. Once the event hub is ready, install the following packages(for IDE, you can create an application in VS code or simply use jupyter notebook in Anaconda environment.
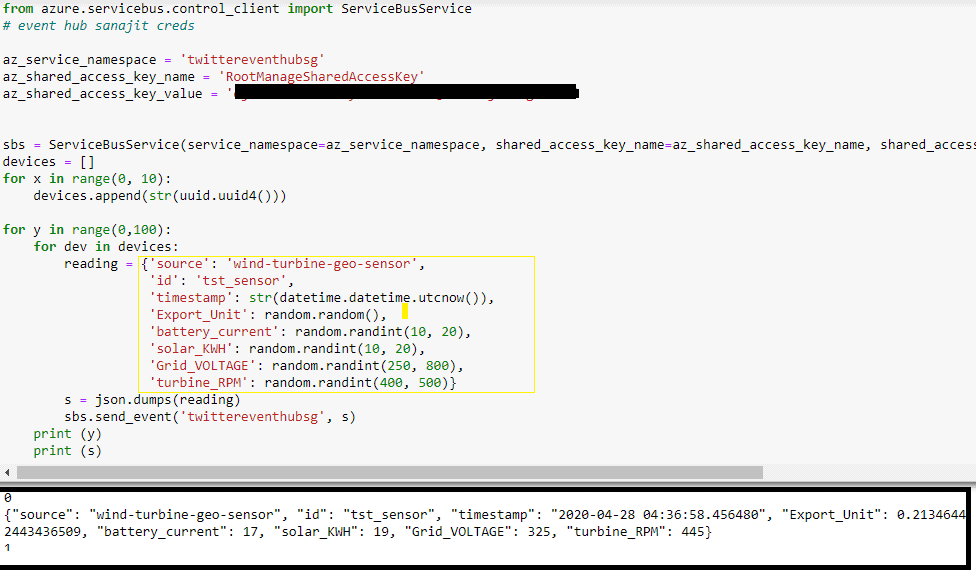
Copy the credentials from the event hub namespace and paste them into the cells. Once the code is ready, try running it and check whether any real-time spike is generated in the dashboard metrics of the event hub.
Below output is a simulation of parameters that are actually being used in a wind turbine. This code generated is JSON metrics and after every 10s it is sent to Azure Event Hub. Our next idea is to process this streaming data with the help of databricks structured streaming.
2. Structured streaming using Databricks and EventHub
The idea of structured streaming is to process and analyze the streaming data from the event hub. For this, we need to connect the event hub to databricks using event hub endpoint connection strings. Use this documentation to get familiar with event hub connection parameters and service endpoints.
Note: Try installing any of these Maven packages across all clusters in the available databricks libraries.
- com.microsoft.azure:azure-eventhubs-spark_2.11:2.3.1
- com.microsoft.azure:azure-eventhubs-spark_2.11:2.3.13
- com.microsoft.azure:azure-eventhubs-spark_2.11:2.3.6

On the successful establishment of a connection with the event hub, run the below code to check whether any stream has started.
Note: We are writing our stream into memory and then fetching the results.
.format(memory) #testing purpose
.queryName(“real_hub) #kind of “select * from read_hub” to get the stream
The below spikes shows how data ingestion takes place from the event hub to databricks.

3. Getting into the actual scenario.
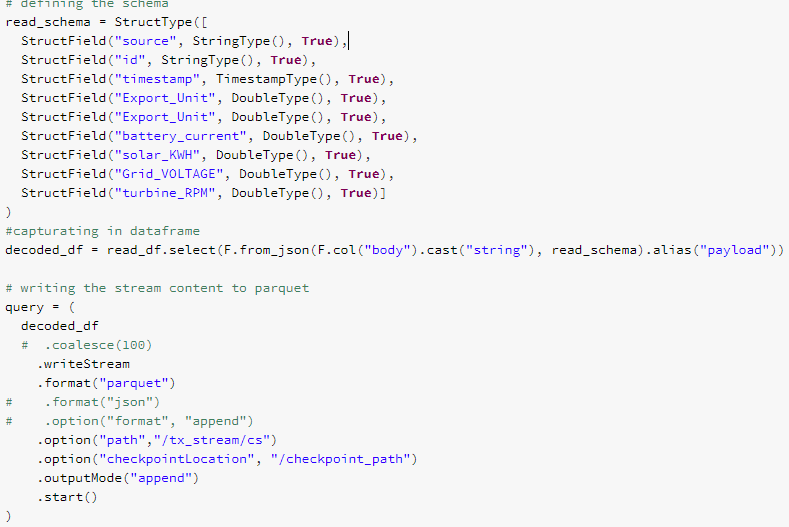
Our objective is not only to view the data in real-time but also to save it in a format that is much faster(parquet) in terms of processing and then visualizing it in other external sources for drawing insights. I have made some tweaks in the code by appending the incoming streams into rows and then saving the streams in parquet files.
Before doing so, I have defined the incoming schema and appended the incoming data into a data frame.
Step 1: Import Spark Session.
Step 2: Configure the schema of the files that you want to upload.
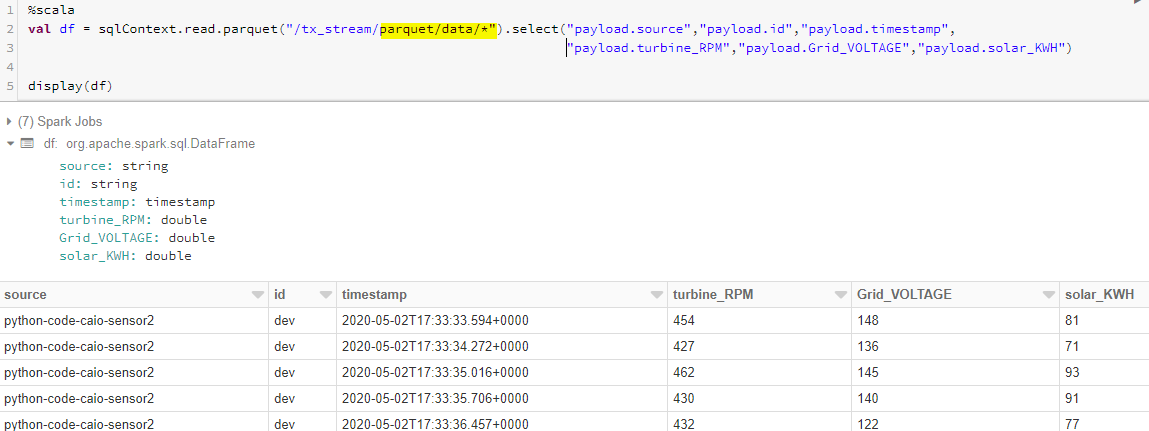
Step 4: From the below snap, you can see that all the parquet files are processed into a single data frame and then an external hive table is created for data analysis purposes.
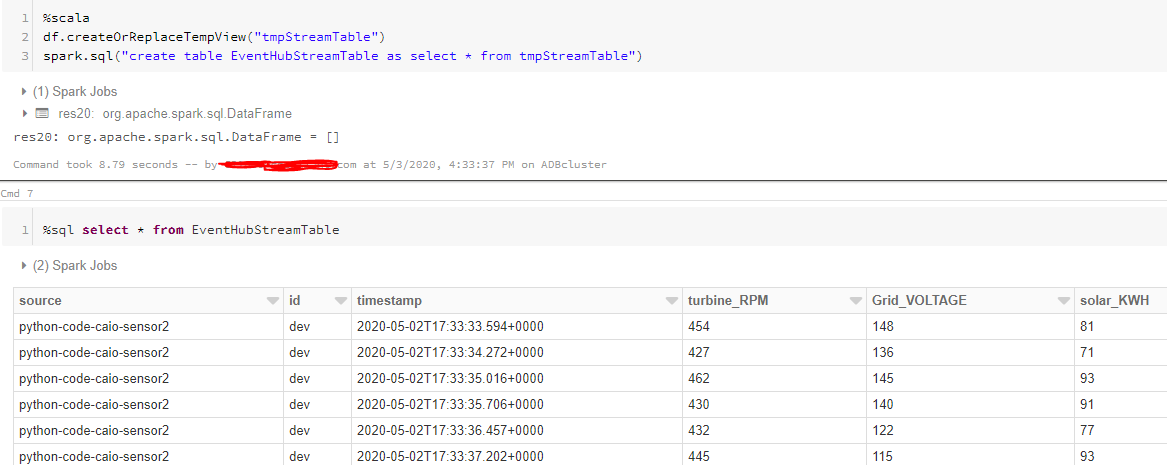
Once the table is created from the data frame, I can easily query out filters from it. Thus, the idea to capture streaming data and representation it in tabular format is successful. We have explained the workflow of processing real-time data from sensors using Azure databricks and Event Hubs.
Now we will focus on the data visualization for given streaming datasets that can be easily on-boarded from databricks hive tables to PoweBI dashboard for drawing various visualization insights.
“Data Visualization is the biggest abstraction behind complex data analysis rules”.
Databricks has an inbuilt data visualization tool that can easily plot, map and bring popular KPIs and insights to the table. But when it comes to rich data visualization techniques, PoweBI can be a great tool that can be integrated with databricks tables.
Step 1: To get started within a few steps, we need to first create a connection URL. Open the datatbricks cluster>Advanced settings>JDBC/ODBC connection.
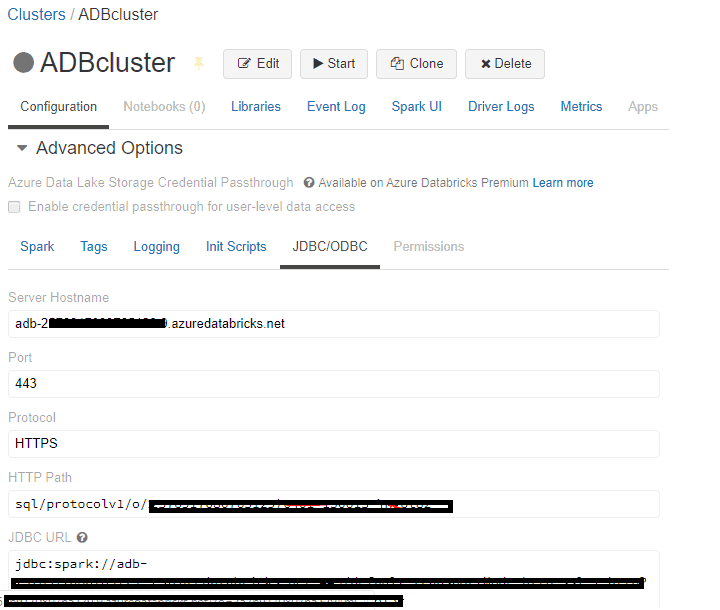
To create the connection url, use the HTTP path to copy the workspace id followed by the secret. sql/protocolv1/o//XXXX-XXXXX-.The bold part and the region should be pasted in the below connection url in this format.
https://.azuredatabricks.net:443/sql/protocolv1/o//XXXX-XXXXX-XXX
Step 2: Generate a new token for a Login password
Click on User Settings>Generate a new token and note down the value. This token value will be later used as a token password while logging into PowerBI.

Step 3: Open PoweBI desktop and search for the spark in Get Data.

Step 4: Copy-paste the connection url which is created in step 1.
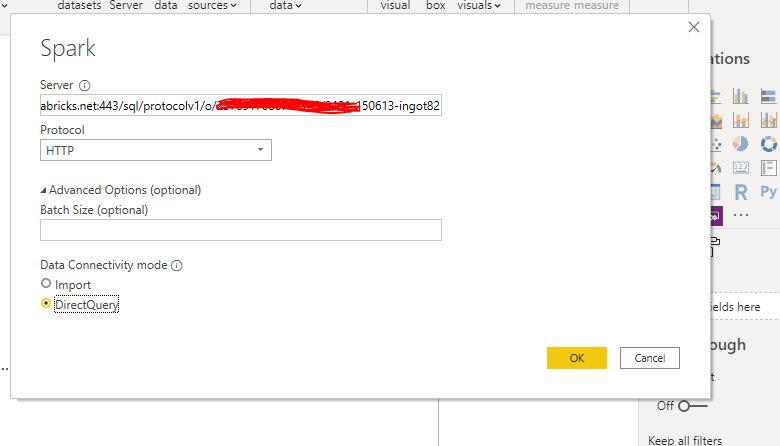

Finally, the connection with the data bricks table is done and now, you will be able to access all the hive tables through PowerBI.
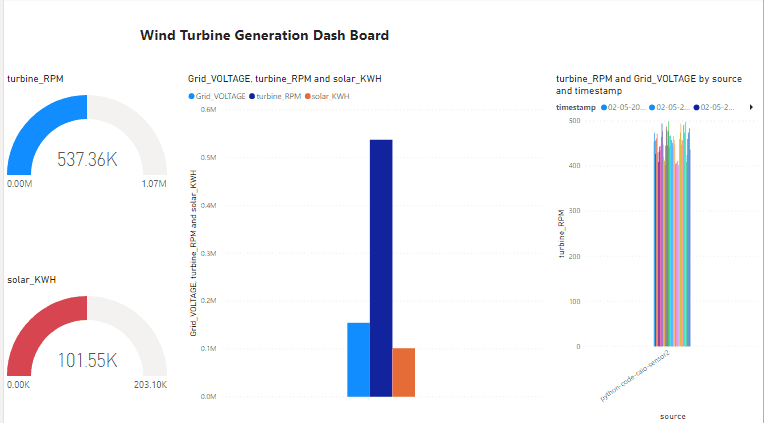
Step 6: Create visualizations to make an insightful Power Bi report.
This is the end of this article, we successfully automate the process of capture streaming data and representation it in tabular format is successful. We have explained the workflow of processing real-time data from sensors using Azure databricks and Event Hubs and then migrating the processed data to Power BI, it will also read new data and apply all the transformations on it with an interval that was defined by the developer. Thank you and feel free to try out some different transformations in data bricks and create some awesome visuals with Power BI.


