Author – Sana Khatoon
Data Engineer
What you will take away from this blog-
- Get familiar with Machine Learning Workspace
- Predict Diabetes Score using Linear Regression
- Integrate Machine Learning Model in Power BI Desktop
- Visualize your model using Python Visuals
Prerequisites-
- Requires Azure Subscription for creating Automated ML Workspace
- Install Python on your system
- Understanding of Linear Regression algorithm
Let’s first have a quick overview on Linear Regression and then we will deep dive into the process of creating Automated ML model and this model will get integrated into Power BI.
Linear Regression Overview
Linear regression is a linear approximation of a relationship between two or more variables. Regressor model are highly used by data scientist to make prediction over continuous numerical values. Basically, the process of linear regression is mentioned as below-
- Come up with the dataset as per your choice but it should follow some objective of making predictions
- Design Machine Learning Model that works on the dataset
- Make predictions on the dataset (based on Linear regression algorithm
There is dependent variable which is called Y being predicted and independent variable X1, X2, X3……….Xn. Here x is a predictor and Y is function of X variables. The simple equation of linear regression is-
Random Forest Model
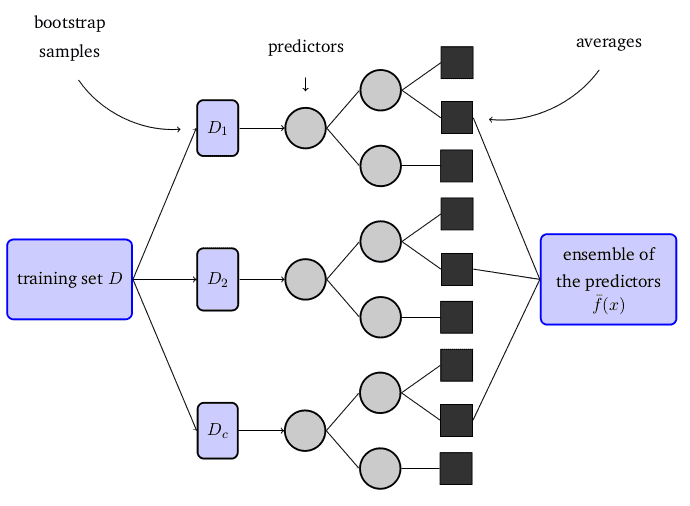
Random forest regression is a bagging technique where the parts of the main dataset get distributed among multiple Decision Trees that will predict the best model. And finally based on the root mean square error(RMSE), it will aggregate the best model or choose the best predictive model.
In Random Forest Process, we have some base learner models like M1, M2, M3 .. Mn. These base learner model are called Decision Trees. Each decision tree will randomly pickup the number of rows and columns from the main dataset, the process is called Row Sampling for rows distribution and Feature Sampling for columns distribution. In this way every base learner/decision tree will have D’ dataset. This will form a bootstrap model which will be aggregated according to the bagging process.
This information is well enough to understand working process of our model.
Creating Machine Learning Workspace
The workspace is the top level of resource which you need to build to work in Machine Learning environment. Azure provides the different types of workspace, according to the needs and requirement user will create the workspace.
In our case, we will create Machine Learning Workspace by following the below steps-
- Go to Azure Portal
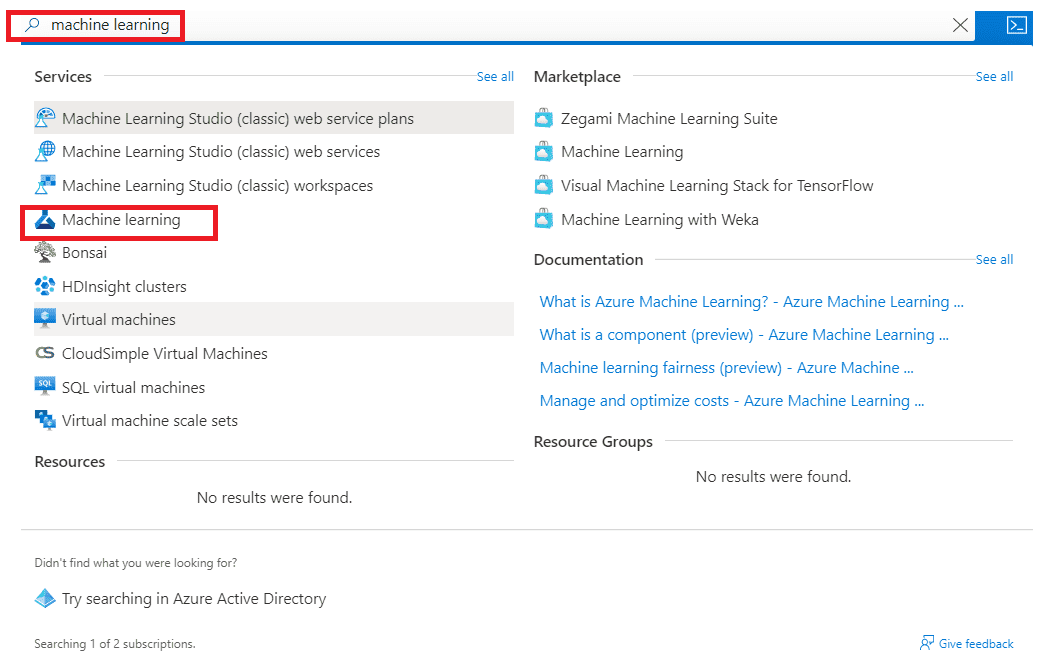
- Search for Machine Learning on search bar
- Select Machine Learning Option
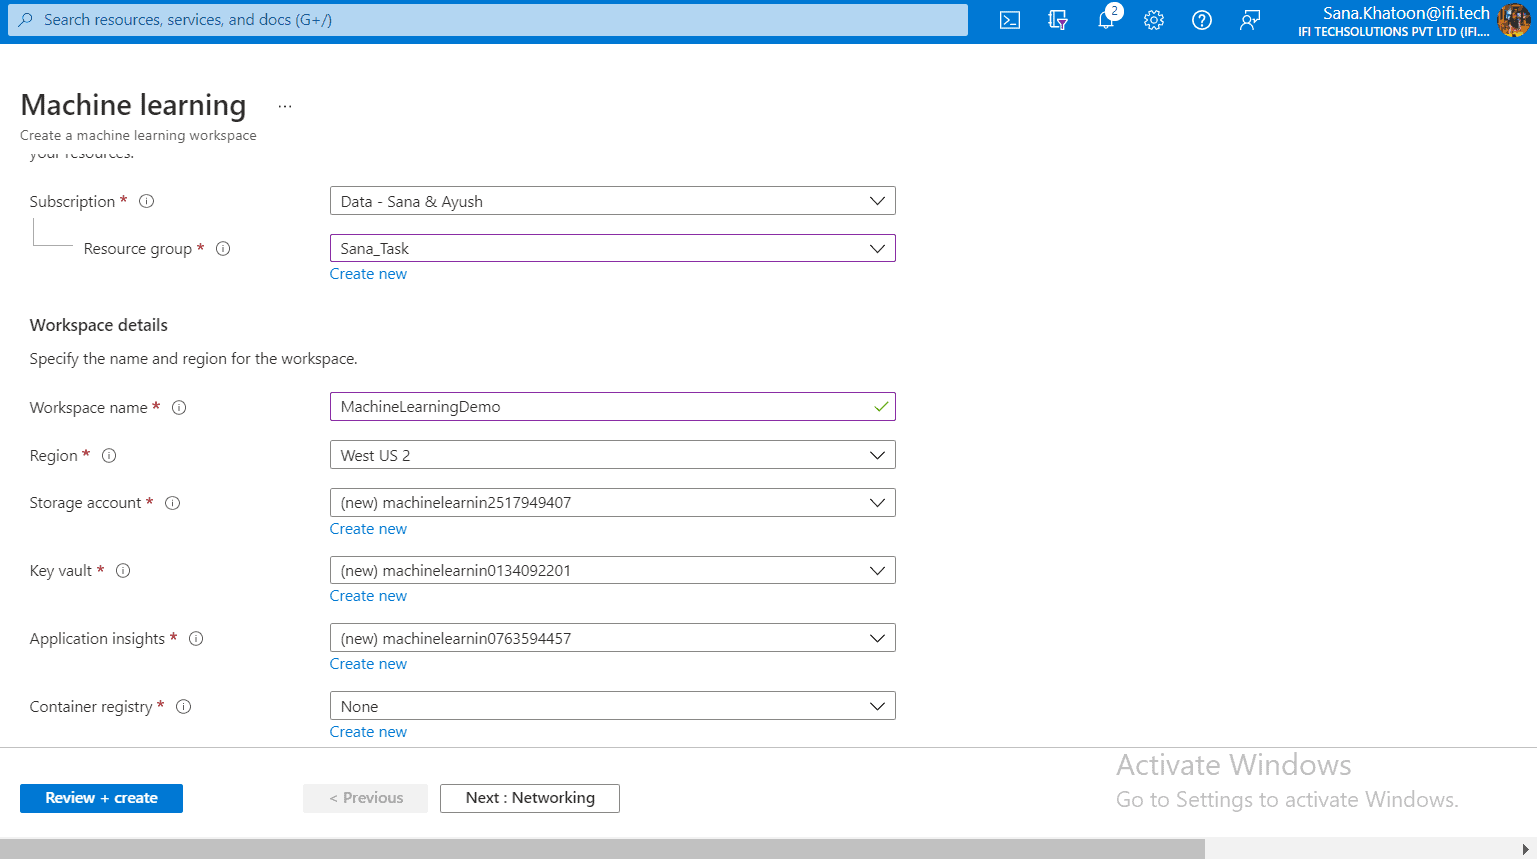
- Click on Create to create the workspace
- Provide the workspace name, rest of the details will be set to default as new
- Click on blue button review and create
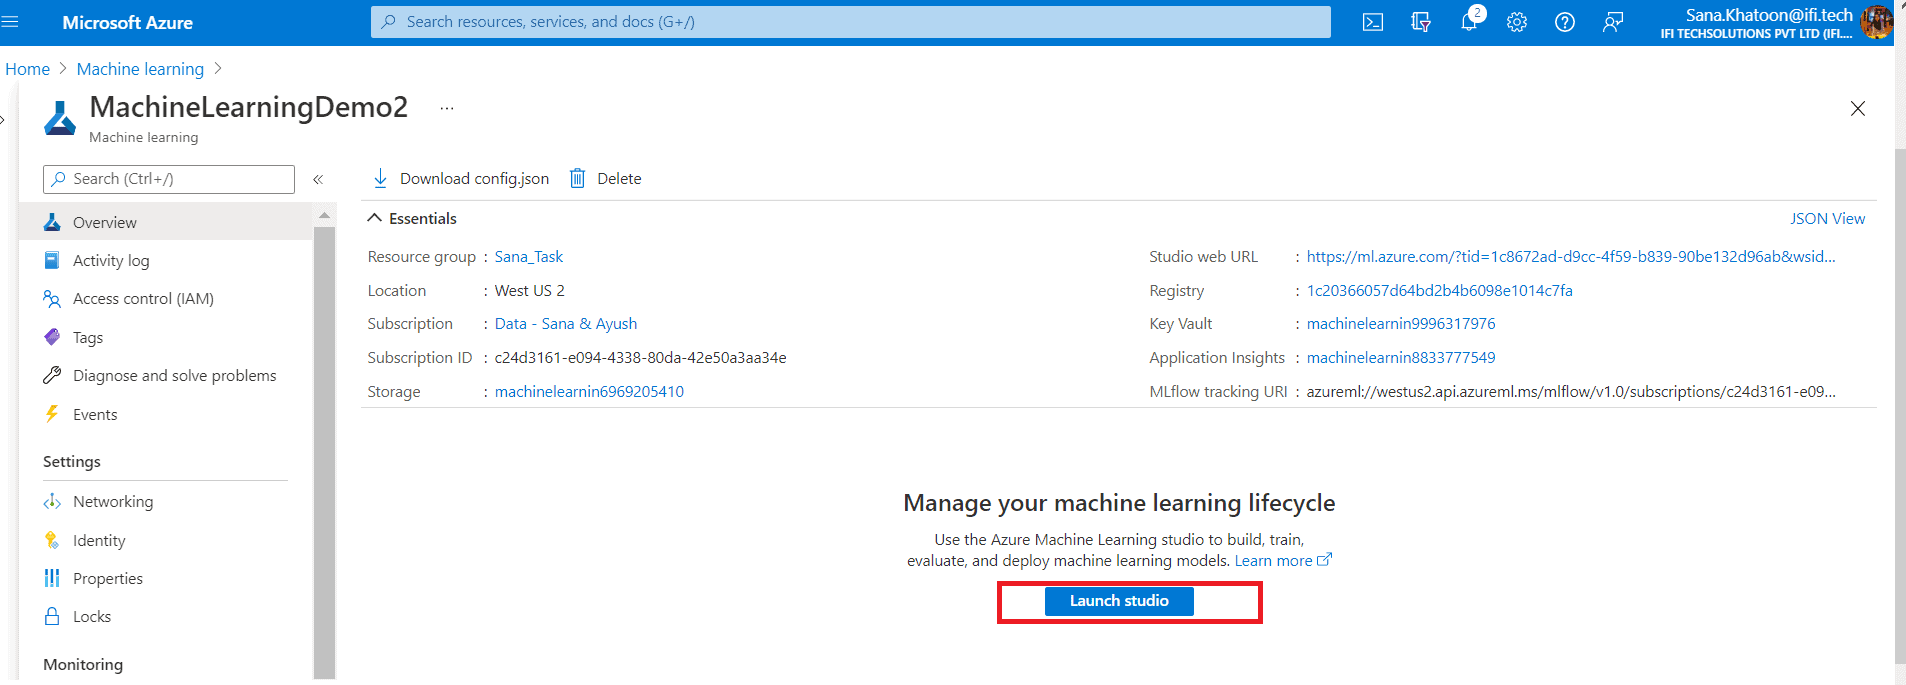
To Launch the workspace, go to the workspace and click Launch Studio.
So, here will get the Machine Learning workspace where we will define the dataset and train the model based on Linear Regression.
Creating Experiments using Automated ML
Follow the below instructions to create the experiment using Automated ML-
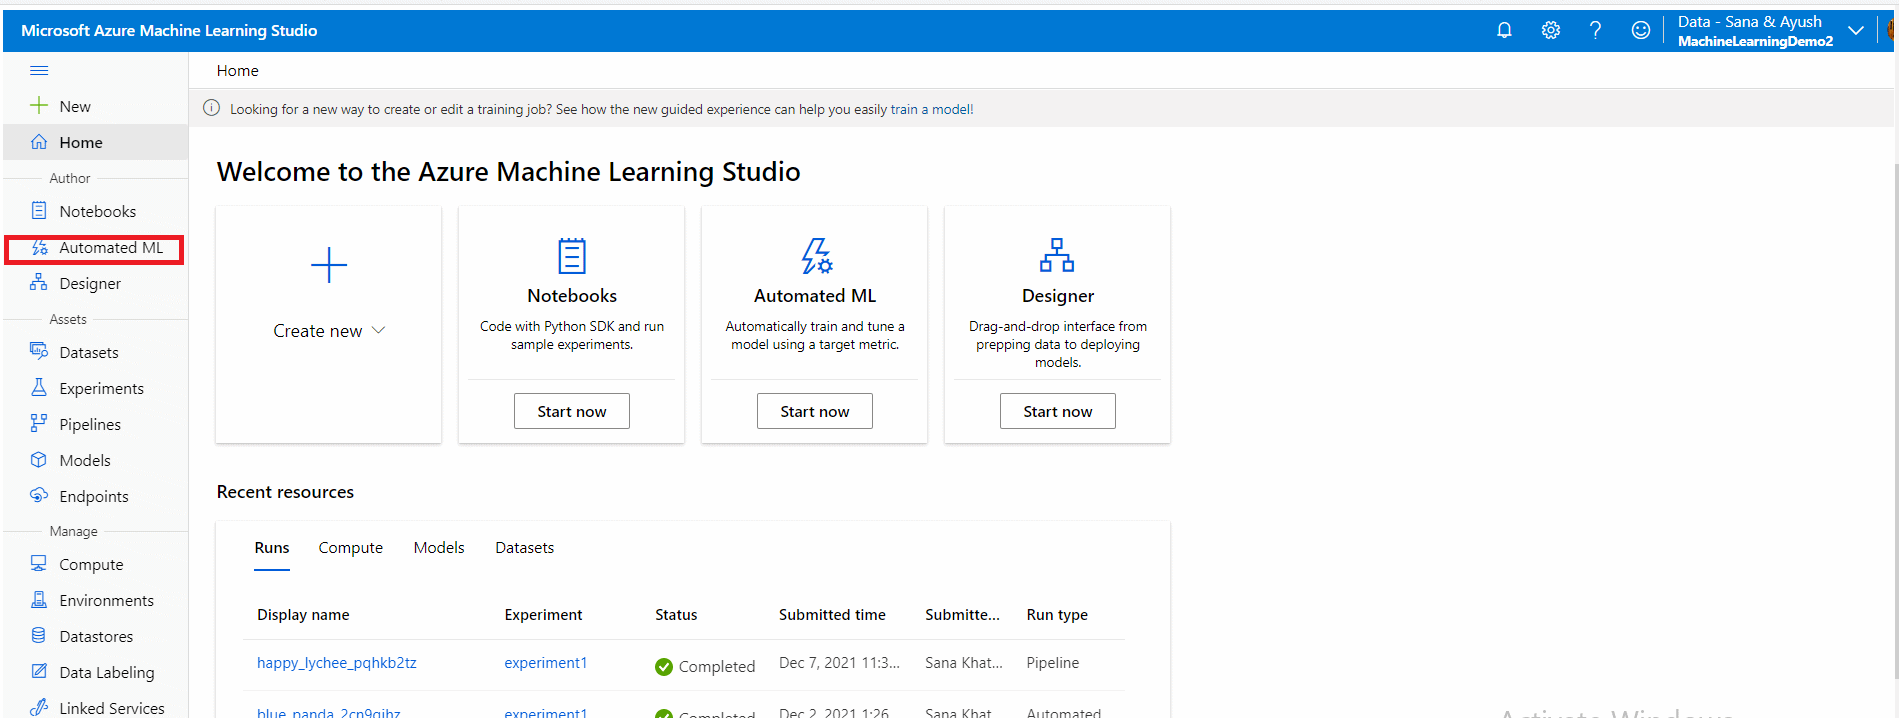
- Click on automated ML option
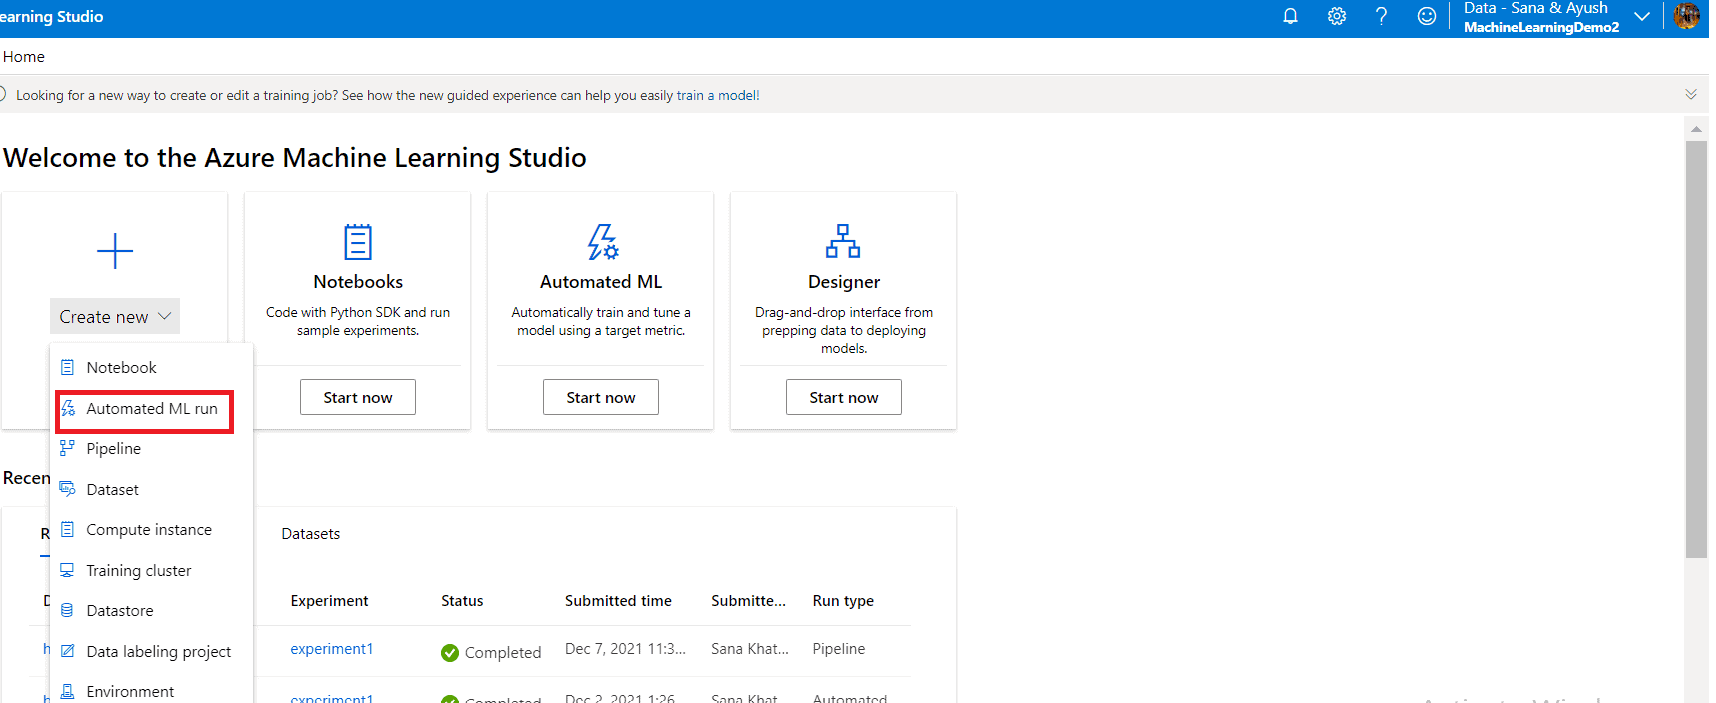
- Click on New Automated ML run
- Click on the Create New Option and select Automated ML run
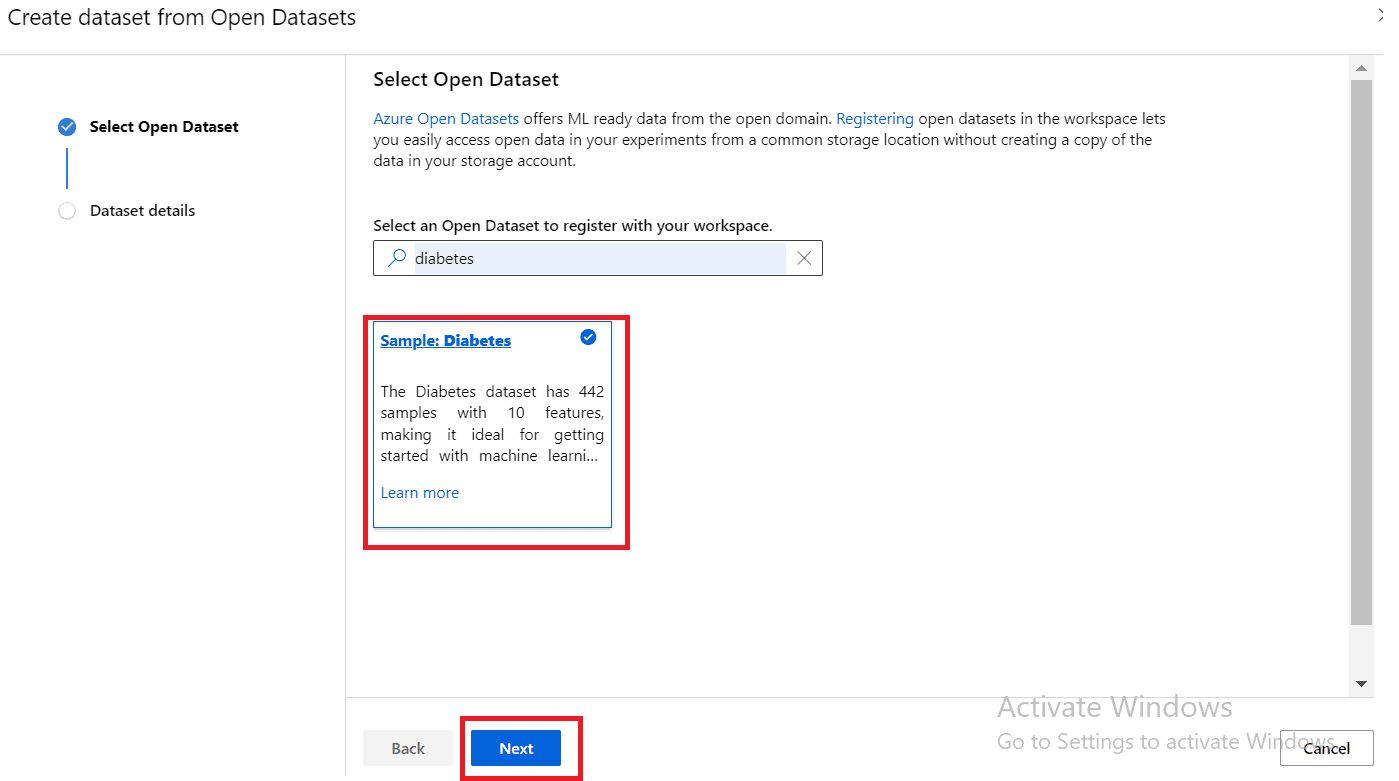
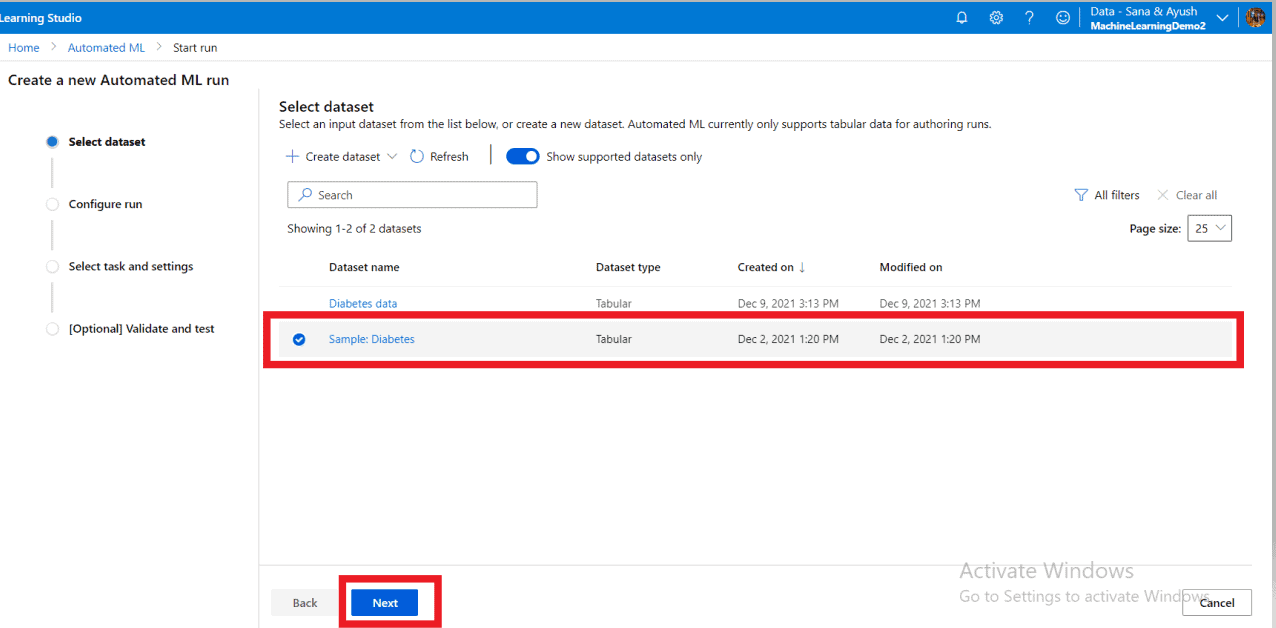
- Next step is to choose the dataset, click on Create datasets and select From open datasets
- Now, search for diabetes in the search box and select sample: Diabetes
- Click on Next
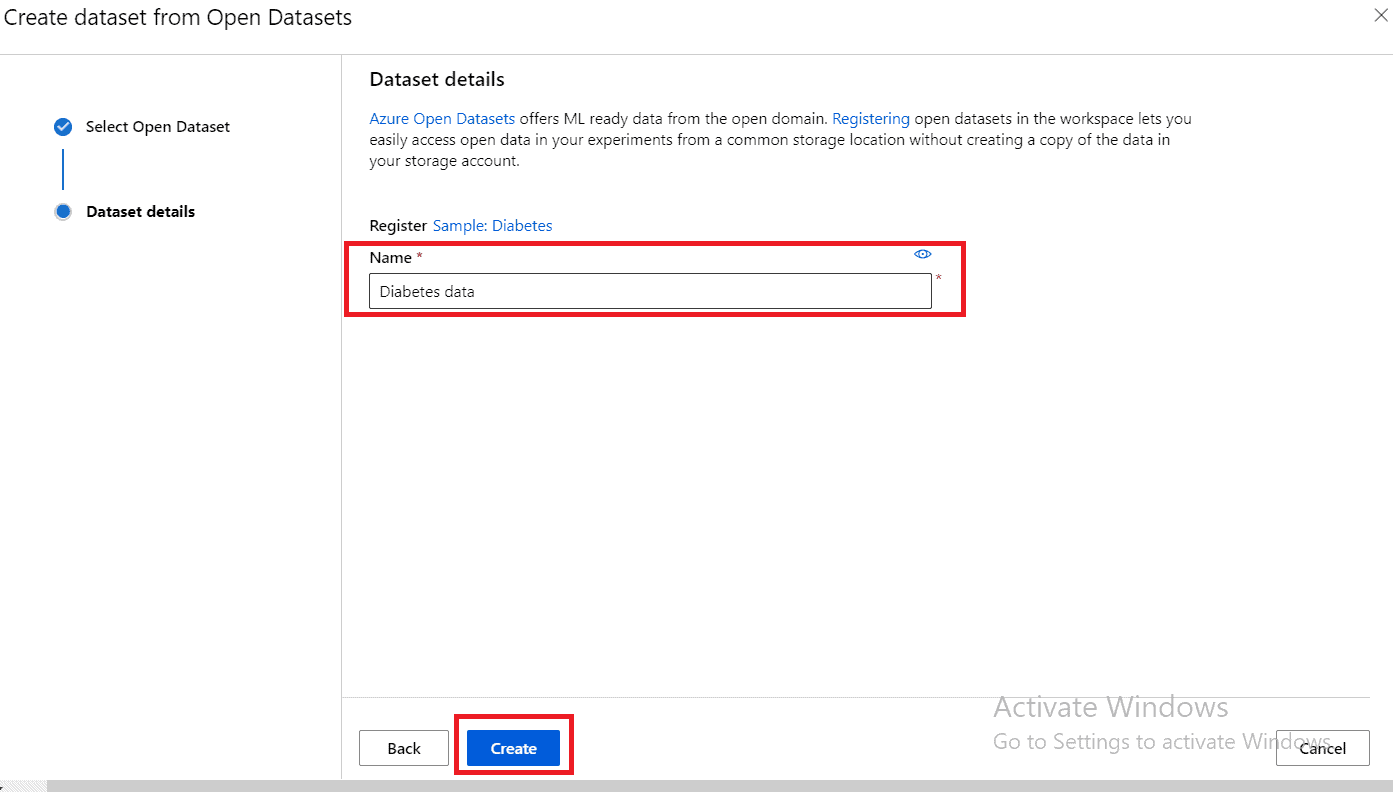
- Give the name of the dataset and click on Create button
Now, we have successfully created the dataset. Next, step is to configure the Model
- Select the Sample: Diabetes and click on Next
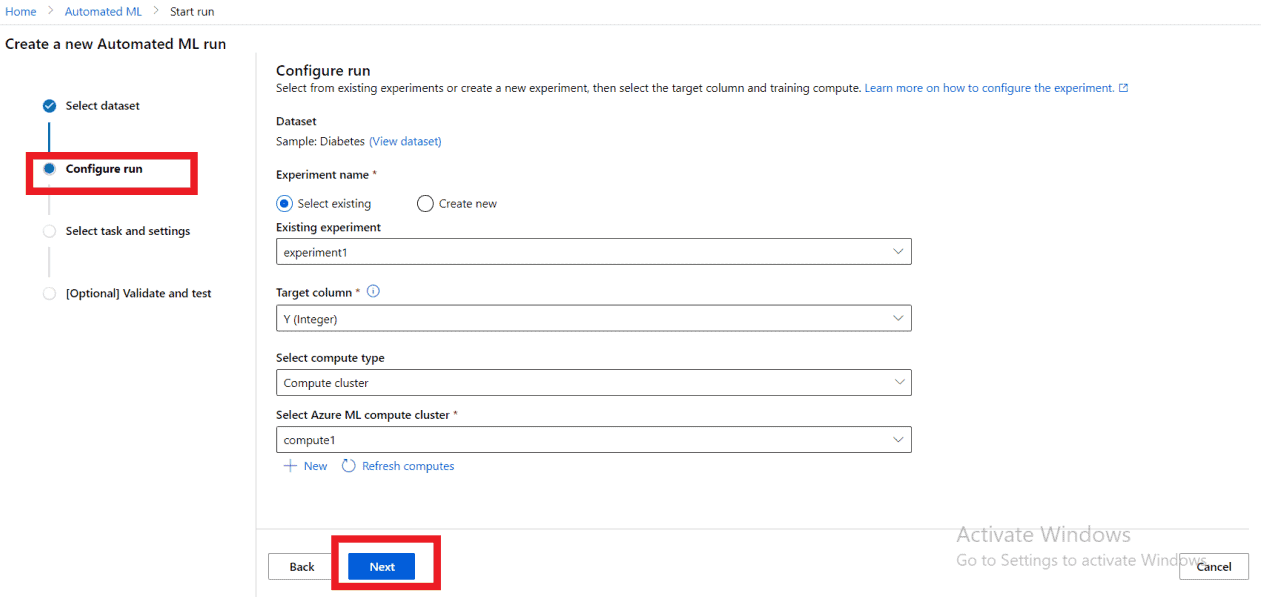
- In the next step, we are required to provide some details as below-
-
-
- Select new experiment
- Give the name of the experiment
- Select Target Column Y ( Actual value on which the model will make predictions)
- Select compute type as compute cluster
- Select Azure ML compute cluster compute1 (if not pre built , you need to create new one)
- Click on Next
-
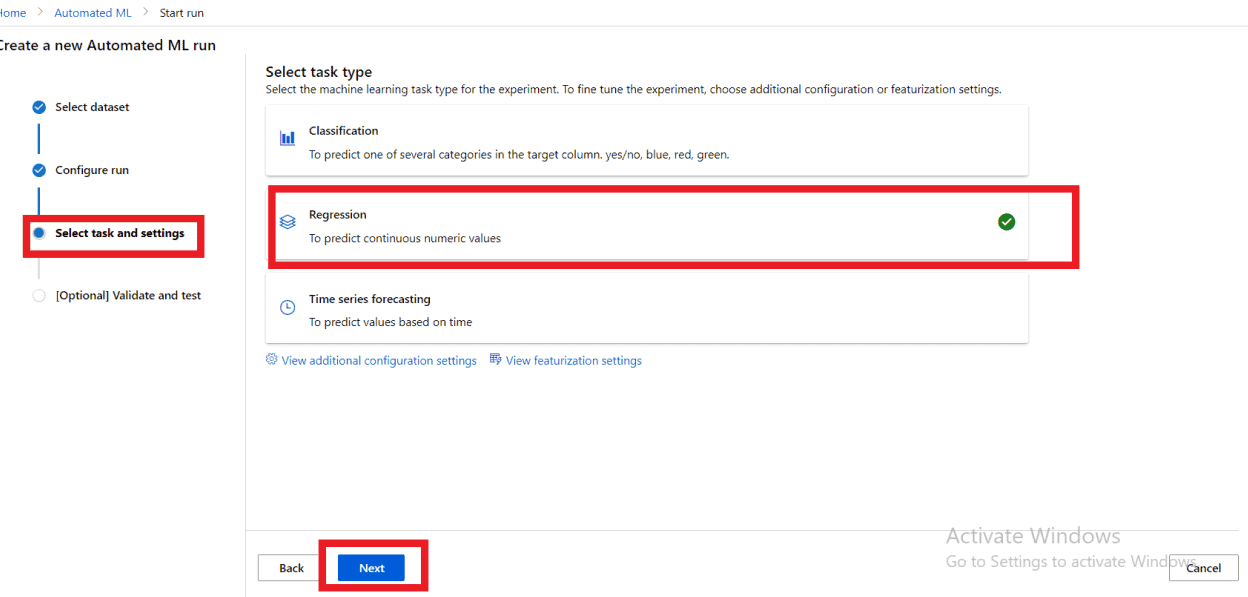
- Now, we need to provide the modelling technique or algorithm on which our model work. In dataset we have Y column which consists of continuous numerical values so we will select Regression here
- Click on Next
Here by default model will select RMSE(Root Mean Square Error) as primary metric. You can change it by clicking on View additional configuration settings.
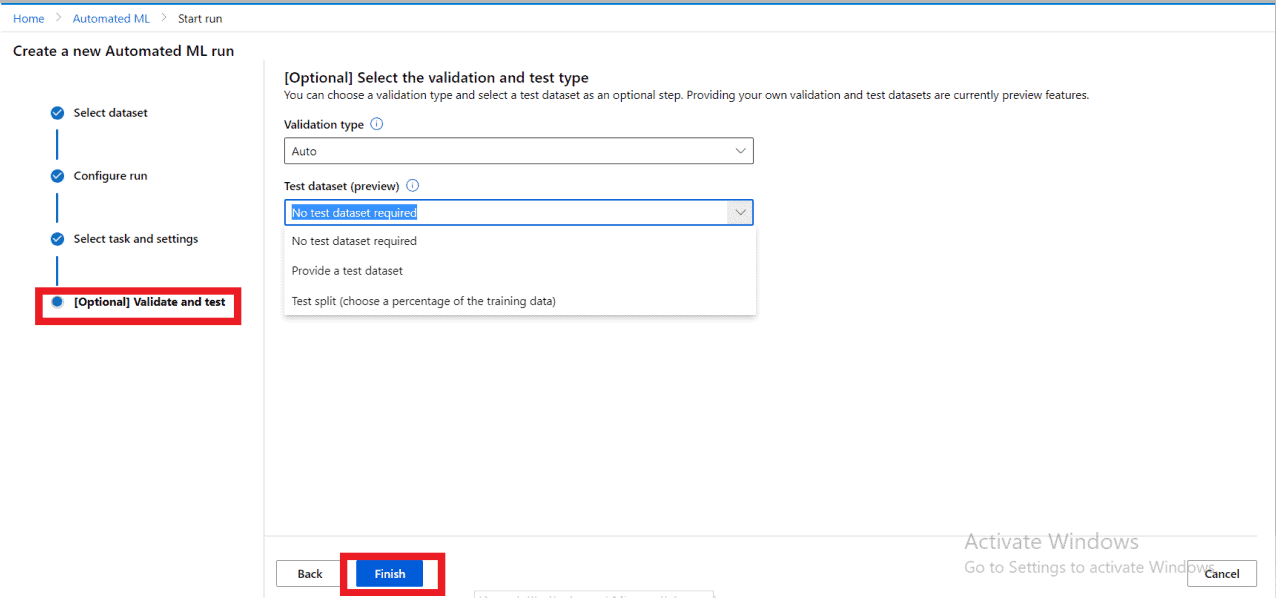
- In the next step, Keep the Auto validation type as Auto
- Select no test dataset required under Test Data Preview Option
- Click on Finish
Now, you may relax and see the magic what Automated ML will prepare for you. This is a code free platform where you need not to worry about the calculations and the logic behind the model. But basic understanding of algorithm is required to understand and interpret the results.
Note- It will take approx. 30 min to train the model.
When you create an experiment, Automated ML will create multiple models for you.
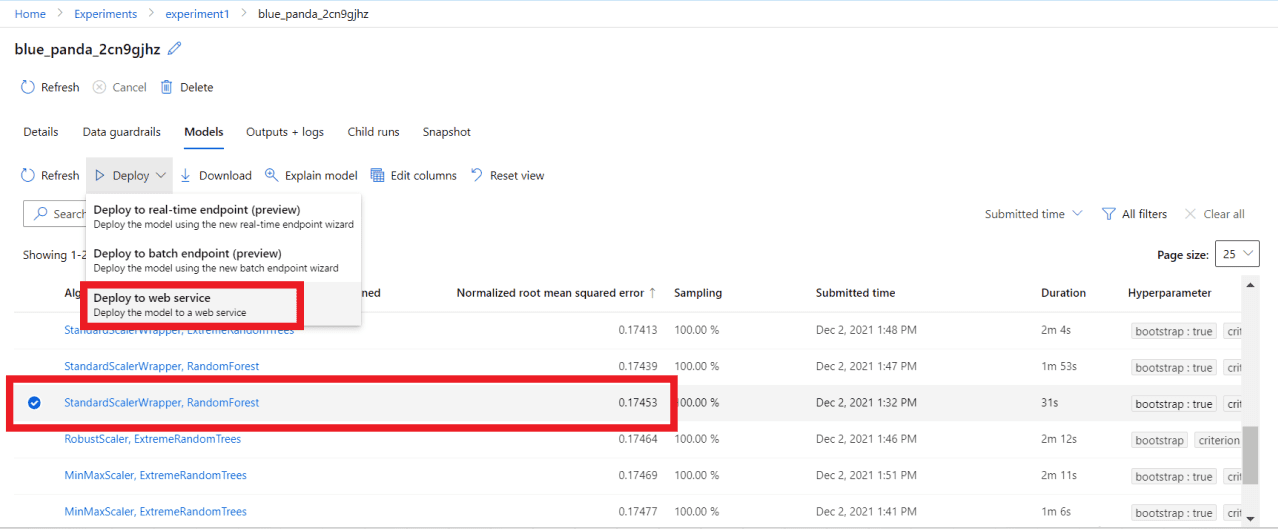
- Based on the normalized root mean squared error, we will select our best model i.e. Random Forest and deploy as a web service
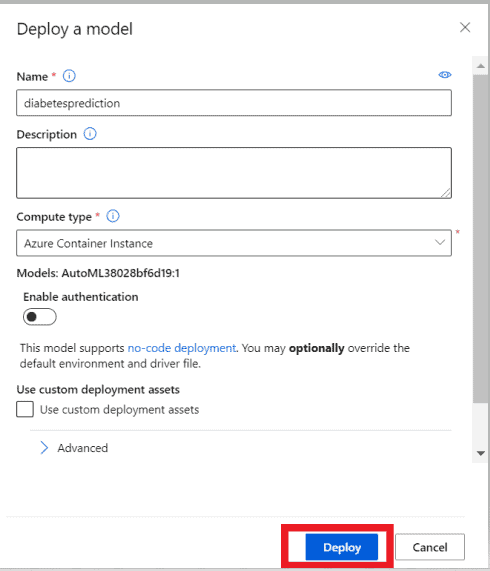
- Here you need to provide some details like name of the model and compute type
- Click on Deploy
Note: If we will not deploy the model , it will be not visible to Power BI
Integrate the model into Power BI
Before integrating the model into Power BI, we will make our Power BI engine compatible with Python
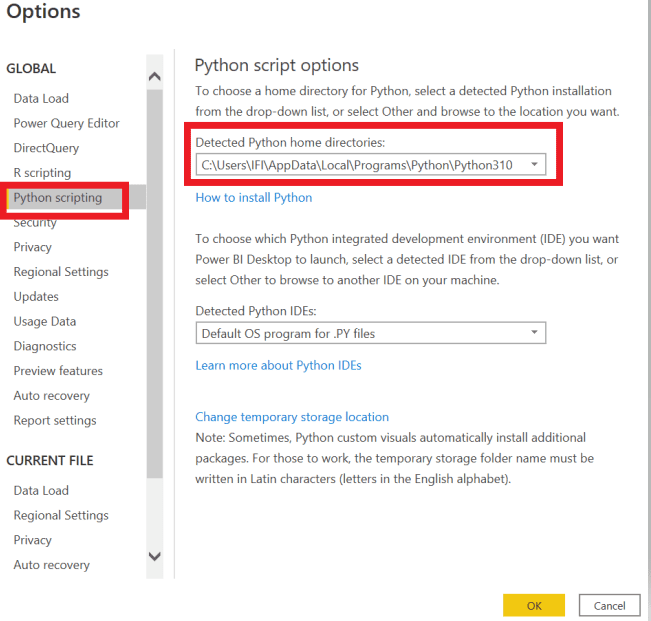
- In Power BI Desktop, Go to File -> Options and Settings -> Options -> Python Scripting
- Now, under the option Detected Python Home Directories give the folder location where your Python is installed
- Install Pandas, Numpy and Matplotlib library using command prompt
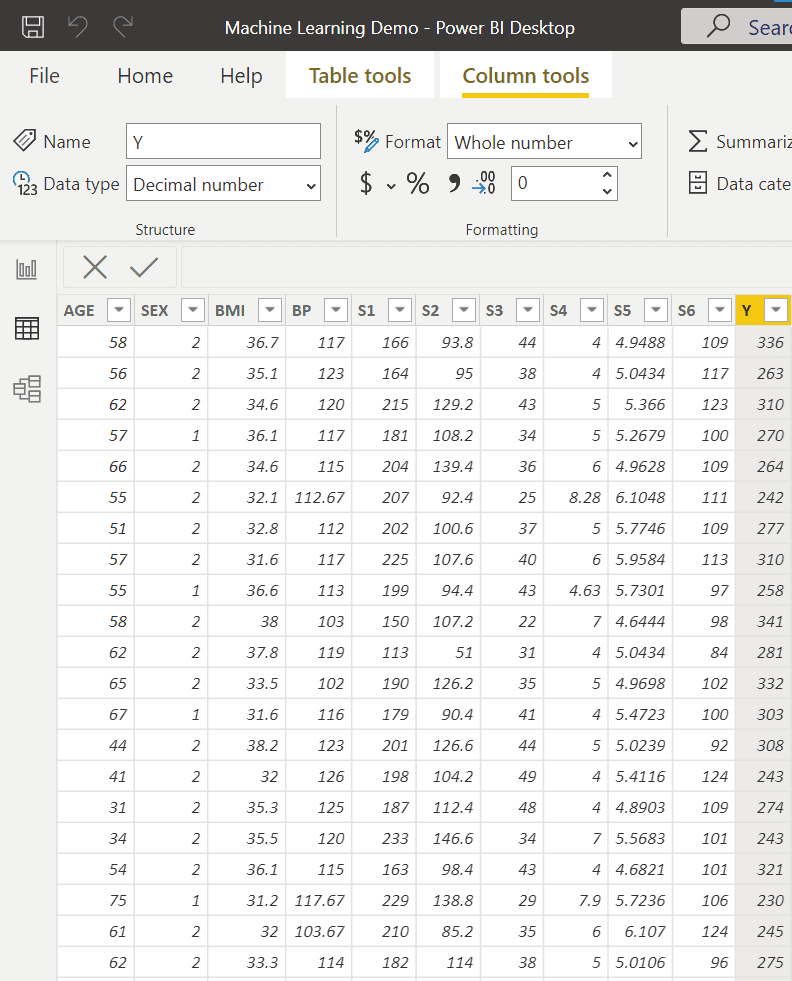
Note – To integrate the model into Power BI, first we need to get the same dataset columns which was passed to our model. Here, records of the table can be different but headers will need to be same as per our model because our model is trained on that headers and only knows same column name.
- In Power BI Desktop our sample data looks like below-
- Now, go to the Home Tab -> Transform Data , Power Query Editor window will appear
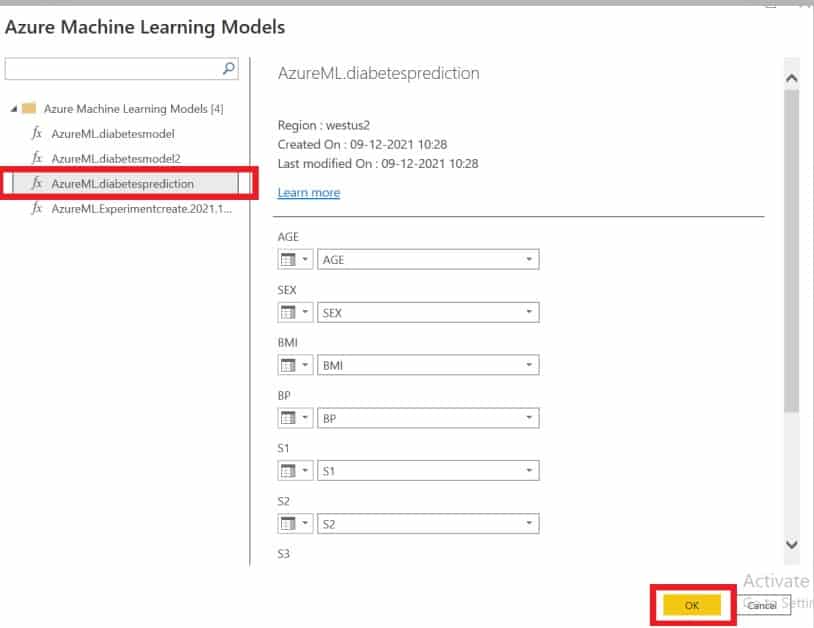
- In Power Query Editor go to Home Tab -> Azure Machine Learning Option
You will get the list of models which has been previously built. Select the model which you have deployed. You can see the Created date and last modified date of the model. As soon as you click on OK button, your model will get loaded into Power BI with the Predictions. You can check the results by changing some records of the dataset.
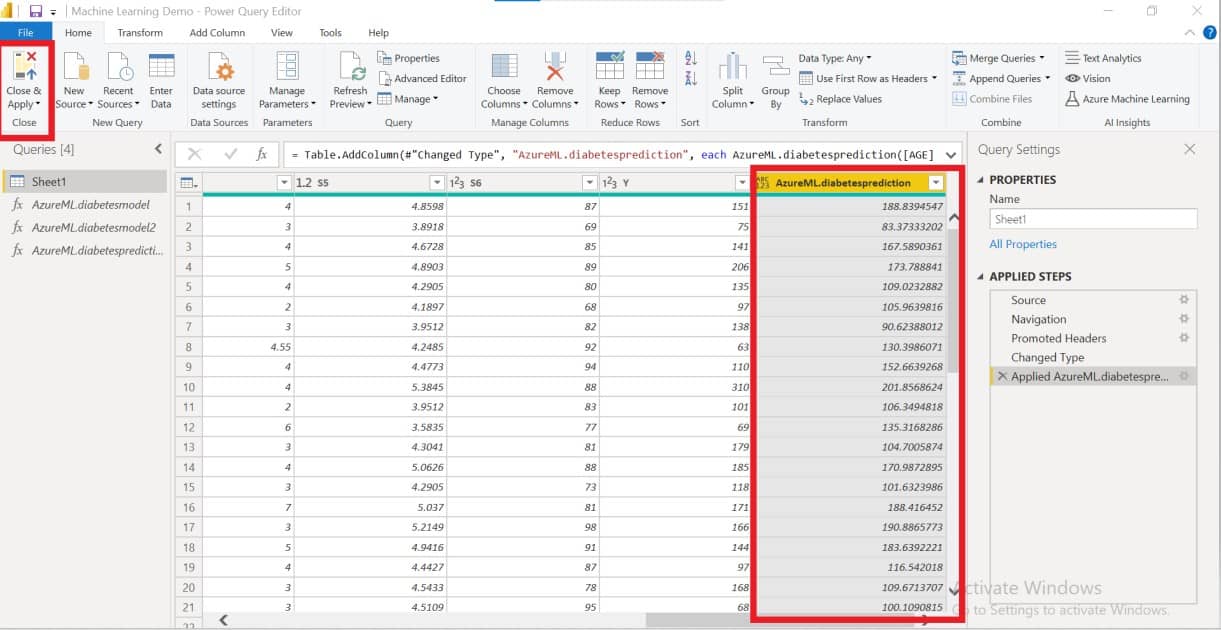
- Now, you can see the predicted value as a column in your dataset. Click on Close & Apply Option
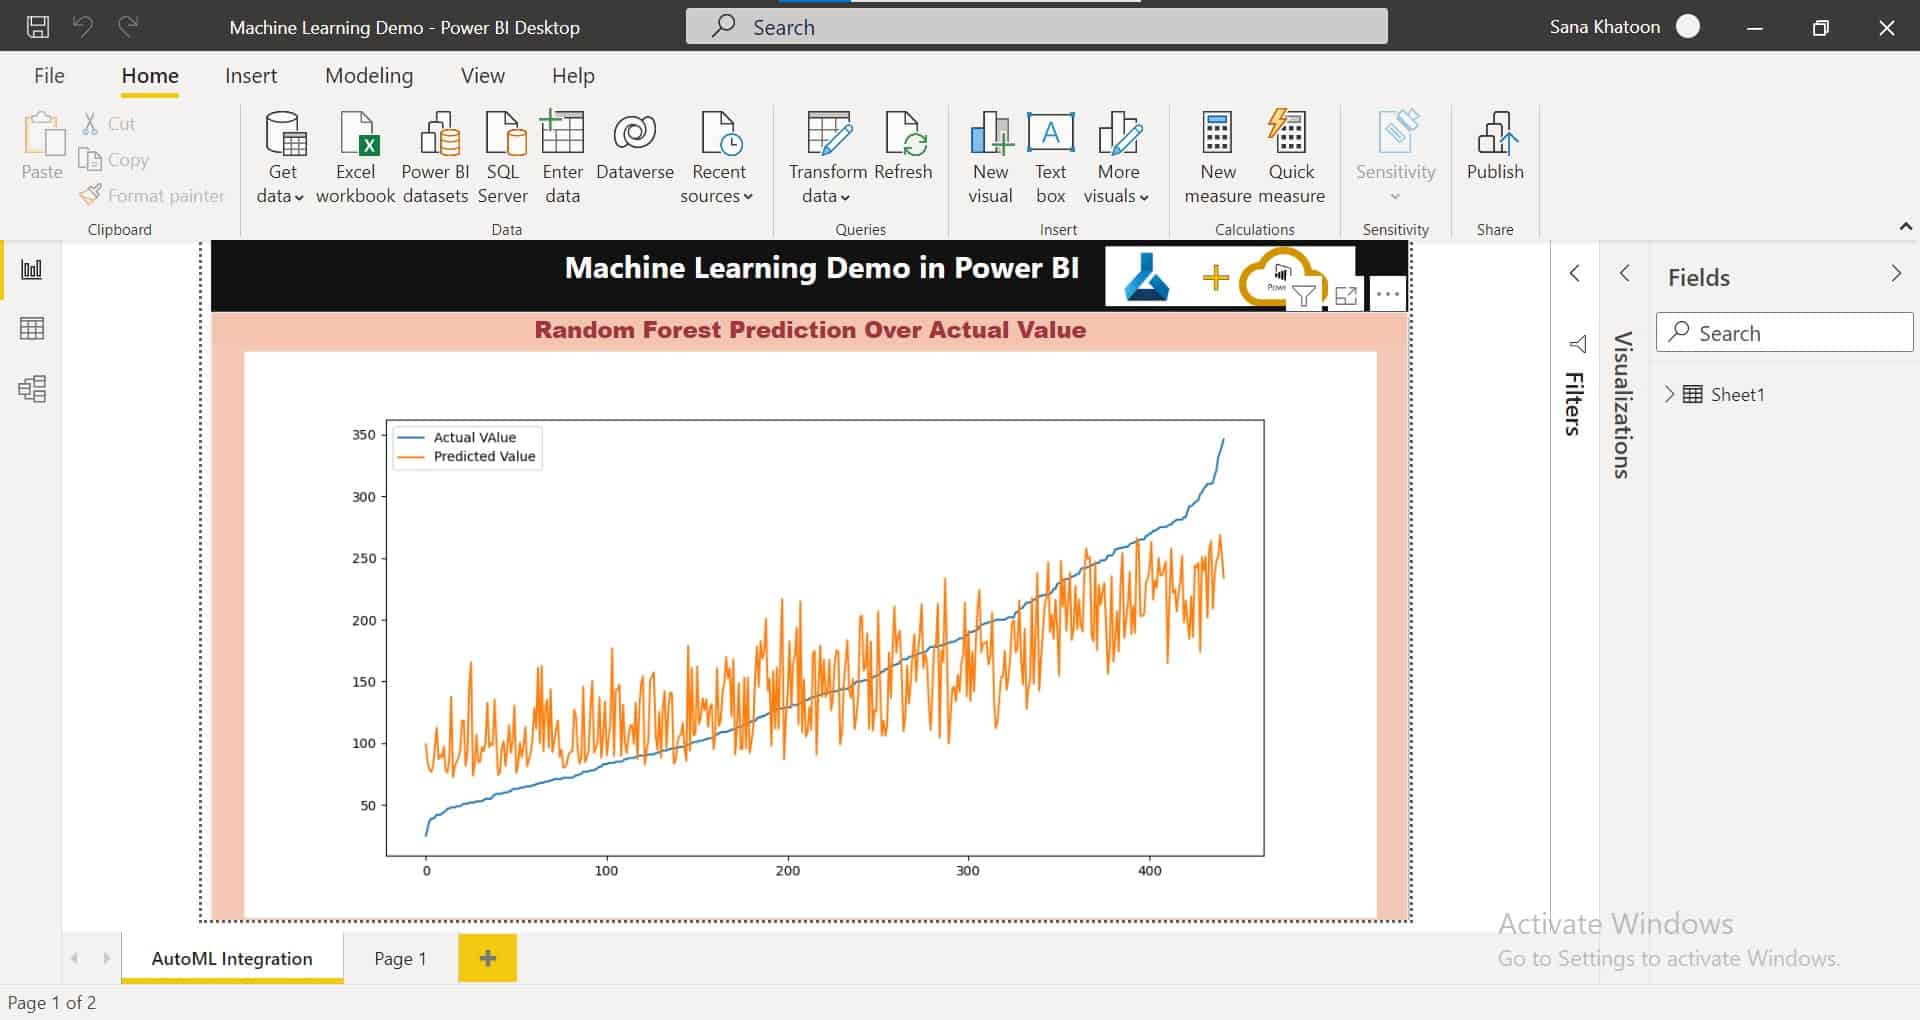
- In the Power BI Desktop under the visualization view, drag the python scripting from visuals
- In the Fields , select Y and the model value which was loaded into the power query editor
- Rename the Y as Actual Value and AzureML:DiabetesPrediction as Predicted Value for better understanding of the visual
Below is the small code which you will need to write under the python script editor to plot the above Line chart-
import matplotlib.pyplot as plt
dataset.plot(figsize=(12,6))
plt.show()


