


Author – Sana Khatoon
Data Engineer
What you will take away from this blog-
 Create Azure Machine Learning Studio (classic) Workspace
Step 1: Go to Azure Portal, search for Azure Machine Learning Studio (classic) Workspace and create
Step 2: Under the Resource Group name select your resource group name if you have already created or create a new one
Step 3: Give the name of your Workspace under Instance details. In my case it is MLForPB
Create Azure Machine Learning Studio (classic) Workspace
Step 1: Go to Azure Portal, search for Azure Machine Learning Studio (classic) Workspace and create
Step 2: Under the Resource Group name select your resource group name if you have already created or create a new one
Step 3: Give the name of your Workspace under Instance details. In my case it is MLForPB Step 4: Now, click on Storage Account. It will ask you to enter a name and choose performance. We need storage account to store our output files.
 Step 5: Now, Click on Web Service Plan. Here you will require a web service, it is used to operationalize your model and generate predictions from the pre trained model.
Step 6: Now, select the Dev Test Standard under the web service plan pricing tier and Click on Review + Create
Step 5: Now, Click on Web Service Plan. Here you will require a web service, it is used to operationalize your model and generate predictions from the pre trained model.
Step 6: Now, select the Dev Test Standard under the web service plan pricing tier and Click on Review + Create
 Now, go to your Azure Machine Learning (classic) Workspace and launch your studio as follows-
 Here you will see a new window as follows. If you are coming first time to this window, you need to login. Now, click on my Experiments, it will redirect you to the project environment.
 Creating a New Experiment
Now, let’s create a new experiment by clicking on blank experiment
Creating a New Experiment
Now, let’s create a new experiment by clicking on blank experiment
 Once you click on blank experiment, you will get the below screen. This area is called Canvas, you can simply search the content and drag it to the canvas.
 We are going to build a model to find Mean and Standard deviation on MPG data for various automobiles then we will integrate and visualize it in Power BI Desktop
Step 1: Search for MPG data for various automobiles and drag it to the dataset canvas
We are going to build a model to find Mean and Standard deviation on MPG data for various automobiles then we will integrate and visualize it in Power BI Desktop
Step 1: Search for MPG data for various automobiles and drag it to the dataset canvas Step 2: If you want to see the dataset what you have selected, right click on the 1 which is circle around on dataset and select visualize option
 Now, we need to do some transformations. Here we will eliminate the columns that will not require in future. I chose to eliminate HorsePower and Model columns.
Step 3: To eliminate column search for Select column dataset and drag it to the canvas then click on Launch column selector and select columns as per your model’s requirement
Now, we need to do some transformations. Here we will eliminate the columns that will not require in future. I chose to eliminate HorsePower and Model columns.
Step 3: To eliminate column search for Select column dataset and drag it to the canvas then click on Launch column selector and select columns as per your model’s requirement
 After that we need to split the dataset into training and testing in the ratio of 8:2
Step 4: Search for Split data and drag it to the canvas. Now, give 0.8 in the Fraction of rows field, this means you are giving 80% of data to the training model
After that we need to split the dataset into training and testing in the ratio of 8:2
Step 4: Search for Split data and drag it to the canvas. Now, give 0.8 in the Fraction of rows field, this means you are giving 80% of data to the training model
 Now, we would require a model to predict mean and deviation, for that we will use Bayesian linear regression Model.
Step 5: Search Bayesian Linear Regression and drag it to the canvas. Now we need to connect it to the training model to the first node and second node of training model will connect to the Split data.
Now, we would require a model to predict mean and deviation, for that we will use Bayesian linear regression Model.
Step 5: Search Bayesian Linear Regression and drag it to the canvas. Now we need to connect it to the training model to the first node and second node of training model will connect to the Split data.
 Basically, what we are doing here is to provide 80% of your data to the training model and with the help of Bayesian Linear Regression statistics, it will evaluate the results. Now, the remaining 20% of dataset will go under testing.
Step 6: Also, we will require a single column that needs to be predict. So, when you click on the train model you will get screen like below. Click on launch column selector
Basically, what we are doing here is to provide 80% of your data to the training model and with the help of Bayesian Linear Regression statistics, it will evaluate the results. Now, the remaining 20% of dataset will go under testing.
Step 6: Also, we will require a single column that needs to be predict. So, when you click on the train model you will get screen like below. Click on launch column selector
 Step 7: Select MPG column
 Step 8: Now, the final step is to score our model. So, search for score model, drag it to the canvas and connect one node to train model and second node to the split data which contain 20% of test dataset
 Step 9: Now, click on Set Up Web Service and select Predictive Web Service to the model. As soon as you click, they can get split into two parts: training experiments and predictive experiments
 Step 10: Now, Click on Deploy Web Service and select Deploy Web Service Preview
 Step 11: Now, after the successful deployment you can check the results. In my case Mean is 8.88 and deviation is 2.92 as per my input data
 Integrate in Power BI
Now, it is time to go final destination i.e. Power BI. You need to install Power BI Desktop on your system and open a new File and Go to Transform data. It will open new window called as Power Query Editor.
Note: You need to first load the data into Power BI Desktop otherwise you won’t get option of Azure Machine Learning in Power Query Editor
Integrate in Power BI
Now, it is time to go final destination i.e. Power BI. You need to install Power BI Desktop on your system and open a new File and Go to Transform data. It will open new window called as Power Query Editor.
Note: You need to first load the data into Power BI Desktop otherwise you won’t get option of Azure Machine Learning in Power Query Editor
 Step 1: Now you are into Power query editor window, here you can do all the transformations. We need to remove columns those are not required and rename the column as per our original dataset.
Step 2: Click Azure Machine Learning option as shown-
Step 1: Now you are into Power query editor window, here you can do all the transformations. We need to remove columns those are not required and rename the column as per our original dataset.
Step 2: Click Azure Machine Learning option as shown-
 Step 3: When you click on Azure Machine Learning, it will load your model that you have built in Azure Machine Learning (classic) Workspace. Click on OK
Note: Privacy policy should be same at both side and you need you install AzureML library or else you might get an error of compatibility issues.
Step 3: When you click on Azure Machine Learning, it will load your model that you have built in Azure Machine Learning (classic) Workspace. Click on OK
Note: Privacy policy should be same at both side and you need you install AzureML library or else you might get an error of compatibility issues.
 Step 4: As soon as you click on OK, the model will get start loading and you will see the results in the form of [Records]. You need to unbind the records by clicking on the double headed arrow as shown below-
 Step 5: All the columns that are present in your model along with Mean and Deviation will populate. Click on OK, you will get the results
 Step 6: Now, click on Close & Apply
 Visualization In Power BI
Step 7: Now, go to visualization view and create your visuals
Visualization In Power BI
Step 7: Now, go to visualization view and create your visuals
 Step 8: Here, I have created two visuals-


- Get familiar with Azure Machine Learning Studio Workspace
- How to create experiments
- Calculate Mean and Standard Deviation on MPG data for various automobiles
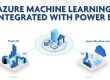
- Integrate Machine Learning Model in Power BI Desktop
- Visualize your model
- Requires Azure Subscription for creating Azure Machine Learning Studio Workspace
- Install Python on your system
- Install AzureML library using python command
- Understanding of Linear Regression algorithm
Create Azure Machine Learning Studio (classic) Workspace
Step 1: Go to Azure Portal, search for Azure Machine Learning Studio (classic) Workspace and create
Step 2: Under the Resource Group name select your resource group name if you have already created or create a new one
Step 3: Give the name of your Workspace under Instance details. In my case it is MLForPB
Step 4: Now, click on Storage Account. It will ask you to enter a name and choose performance. We need storage account to store our output files.
Step 5: Now, Click on Web Service Plan. Here you will require a web service, it is used to operationalize your model and generate predictions from the pre trained model.
Step 6: Now, select the Dev Test Standard under the web service plan pricing tier and Click on Review + Create
Now, go to your Azure Machine Learning (classic) Workspace and launch your studio as follows-
Here you will see a new window as follows. If you are coming first time to this window, you need to login. Now, click on my Experiments, it will redirect you to the project environment.
Creating a New Experiment
Now, let’s create a new experiment by clicking on blank experiment
Once you click on blank experiment, you will get the below screen. This area is called Canvas, you can simply search the content and drag it to the canvas.
We are going to build a model to find Mean and Standard deviation on MPG data for various automobiles then we will integrate and visualize it in Power BI Desktop
Step 1: Search for MPG data for various automobiles and drag it to the dataset canvas
Step 2: If you want to see the dataset what you have selected, right click on the 1 which is circle around on dataset and select visualize option
Now, we need to do some transformations. Here we will eliminate the columns that will not require in future. I chose to eliminate HorsePower and Model columns.
Step 3: To eliminate column search for Select column dataset and drag it to the canvas then click on Launch column selector and select columns as per your model’s requirement
After that we need to split the dataset into training and testing in the ratio of 8:2
Step 4: Search for Split data and drag it to the canvas. Now, give 0.8 in the Fraction of rows field, this means you are giving 80% of data to the training model
Now, we would require a model to predict mean and deviation, for that we will use Bayesian linear regression Model.
Step 5: Search Bayesian Linear Regression and drag it to the canvas. Now we need to connect it to the training model to the first node and second node of training model will connect to the Split data.
Basically, what we are doing here is to provide 80% of your data to the training model and with the help of Bayesian Linear Regression statistics, it will evaluate the results. Now, the remaining 20% of dataset will go under testing.
Step 6: Also, we will require a single column that needs to be predict. So, when you click on the train model you will get screen like below. Click on launch column selector
Step 7: Select MPG column
Step 8: Now, the final step is to score our model. So, search for score model, drag it to the canvas and connect one node to train model and second node to the split data which contain 20% of test dataset
Step 9: Now, click on Set Up Web Service and select Predictive Web Service to the model. As soon as you click, they can get split into two parts: training experiments and predictive experiments
Step 10: Now, Click on Deploy Web Service and select Deploy Web Service Preview
Step 11: Now, after the successful deployment you can check the results. In my case Mean is 8.88 and deviation is 2.92 as per my input data
Integrate in Power BI
Now, it is time to go final destination i.e. Power BI. You need to install Power BI Desktop on your system and open a new File and Go to Transform data. It will open new window called as Power Query Editor.
Note: You need to first load the data into Power BI Desktop otherwise you won’t get option of Azure Machine Learning in Power Query Editor
Step 1: Now you are into Power query editor window, here you can do all the transformations. We need to remove columns those are not required and rename the column as per our original dataset.
Step 2: Click Azure Machine Learning option as shown-
Step 3: When you click on Azure Machine Learning, it will load your model that you have built in Azure Machine Learning (classic) Workspace. Click on OK
Note: Privacy policy should be same at both side and you need you install AzureML library or else you might get an error of compatibility issues.
Step 4: As soon as you click on OK, the model will get start loading and you will see the results in the form of [Records]. You need to unbind the records by clicking on the double headed arrow as shown below-
Step 5: All the columns that are present in your model along with Mean and Deviation will populate. Click on OK, you will get the results
Step 6: Now, click on Close & Apply
Visualization In Power BI
Step 7: Now, go to visualization view and create your visuals
Step 8: Here, I have created two visuals-
- Page 1: In this visual, I choose bubble chart which shows the best fit line along with the outliers. The linear regression equation comes up with all the MPGs value is y=7.59x+14.43 which will vary when you change the MPG value.
- Page 2: In the second visual, you can simply see the mean and deviation for each MPG value which is presented in Line Chart