Author – Nimai Ahluwalia, Cloud Engineer
Power BI is a suite of business analytics tools to analyze data and share insights. Monitor your business and get answers quickly with rich dashboards available on every device.
Power BI comes up with great and some amazing features every month which is making it more effective and powerful tool down the line.
We will understand some great features of Power BI in this blog which will help us to visualize and model the data more efficiently.
This Blog will be covering features like:


 Real-time traffic overlay:
This is a very effective map visual where we can track the live status of the traffic and relate with our data if necessary.
Real-time traffic is overlaid on the map and provides a quick visual reference of which technicians (Blue bubble) are most likely to be delayed getting to their next job due to traffic congestion.
Real-time traffic overlay:
This is a very effective map visual where we can track the live status of the traffic and relate with our data if necessary.
Real-time traffic is overlaid on the map and provides a quick visual reference of which technicians (Blue bubble) are most likely to be delayed getting to their next job due to traffic congestion.
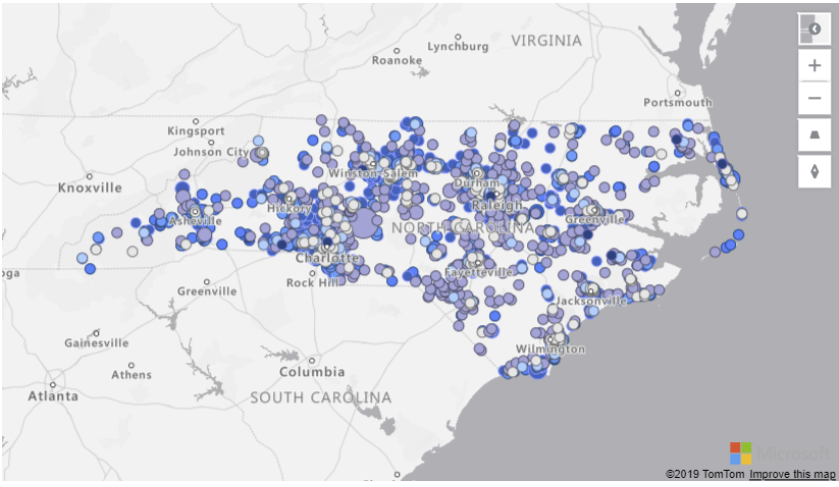
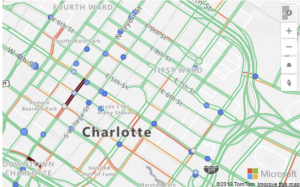 Bubble Layer:
Bubble layers are a great way to represent location data as scaled circles on the map.
Allowing the user to easily visualize two metrics for each location on the map, scale and category.
For example, the following image shows bicycle accident locations in North Carolina. The colour indicates the speed limit of the road the accident occurred on and the size is based on the number of individuals involved in the accident.
Bubble Layer:
Bubble layers are a great way to represent location data as scaled circles on the map.
Allowing the user to easily visualize two metrics for each location on the map, scale and category.
For example, the following image shows bicycle accident locations in North Carolina. The colour indicates the speed limit of the road the accident occurred on and the size is based on the number of individuals involved in the accident.

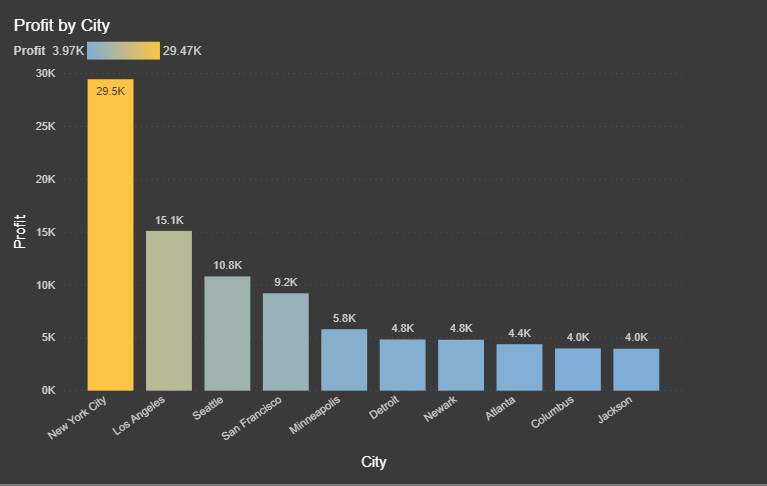
- Gradient Legend.
- Relative Data Slicer.
- Q&A Feature.
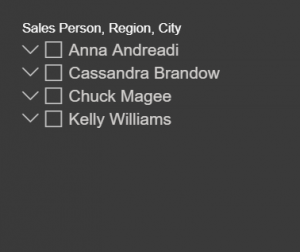
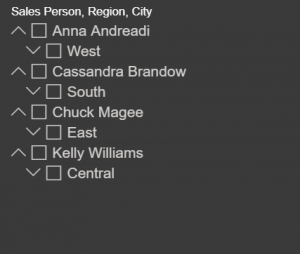
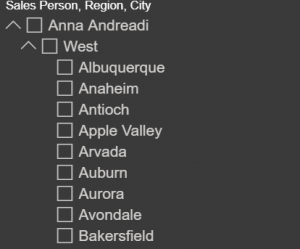
- Hierarchical slicer
- Azure Map Visual
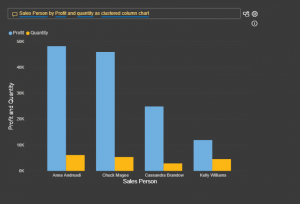
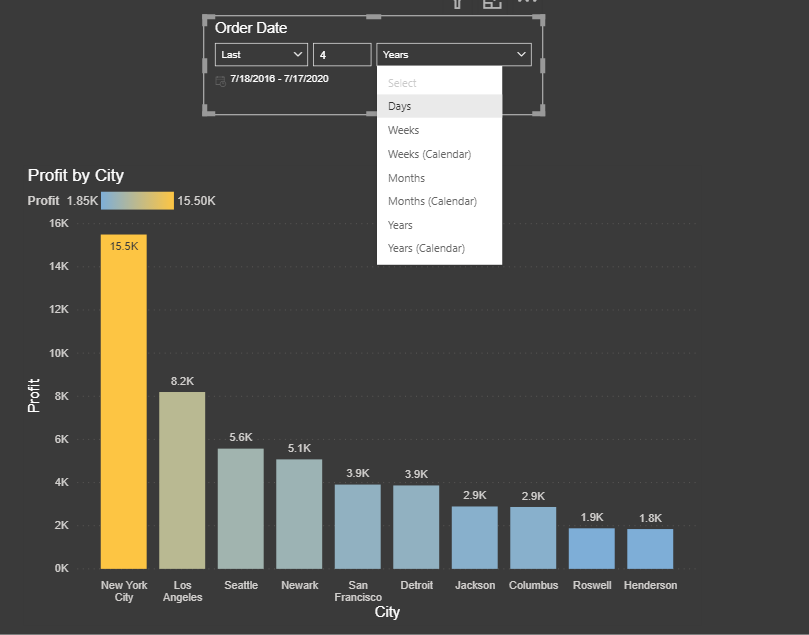
- Top 10 City’s conditionally formatted by Profit with Gradient Legend Feature.
- Advance Relative Date filter
- Asking Questions to your Data using Everyday Language Now!
- The question box. This is where the user types the question.
- A pre-populated list of suggested questions.
- Icon to convert the Q&A visual to a standard Visual.
- Icon to open Q&A tooling which allows configuring the natural language engine.
- Hierarchical slicer
-
-
-
-
-
-
-
-
-
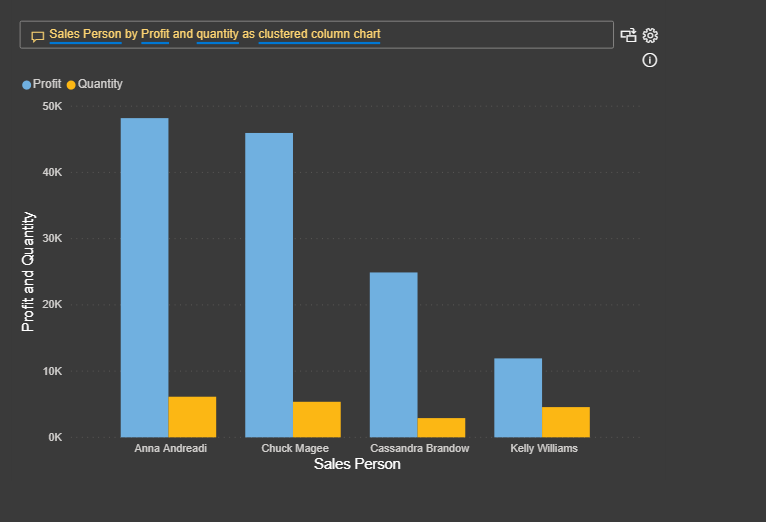
- Sales Person –
-
-
-
-
-
-
-
-
-
-
-
-
-
-
-
-
-
- Sales Person – Region
-
-
-
-
-
-
-
-
-
-
-
-
-
-
-
-
-
- Sales Person – Region – City
-
-
-
-
-
-
-
-
- Azure Map Visual (preview)
- Bubble layer
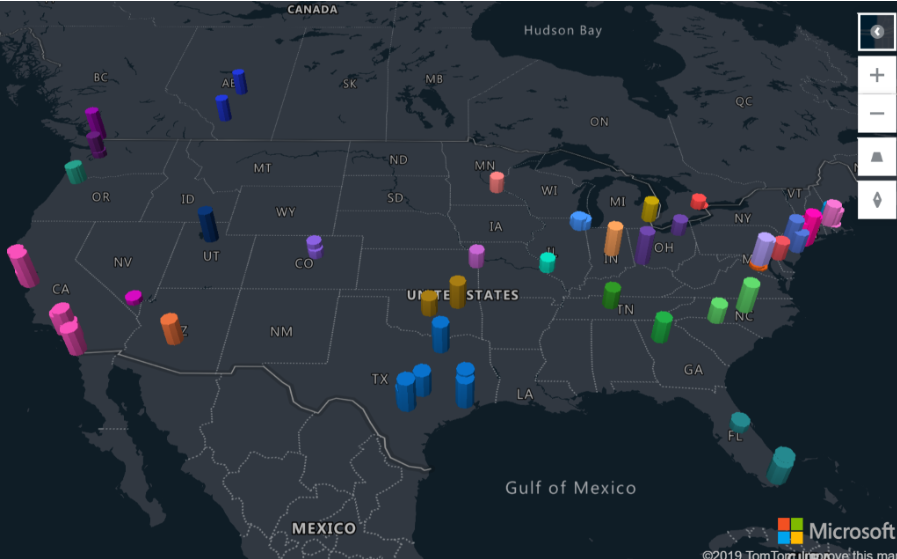
- 3D bar chart layer
- Reference layer
- Custom Layer
- Real-time traffic overlay
 Real-time traffic overlay:
This is a very effective map visual where we can track the live status of the traffic and relate with our data if necessary.
Real-time traffic is overlaid on the map and provides a quick visual reference of which technicians (Blue bubble) are most likely to be delayed getting to their next job due to traffic congestion.
Real-time traffic overlay:
This is a very effective map visual where we can track the live status of the traffic and relate with our data if necessary.
Real-time traffic is overlaid on the map and provides a quick visual reference of which technicians (Blue bubble) are most likely to be delayed getting to their next job due to traffic congestion.
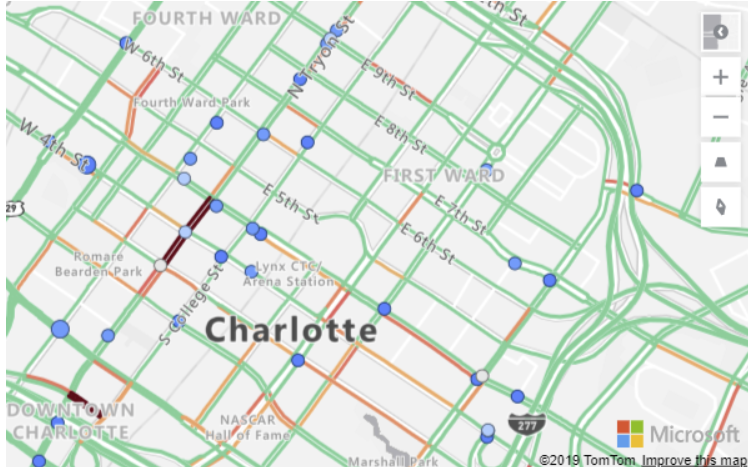 Bubble Layer:
Bubble layers are a great way to represent location data as scaled circles on the map.
Allowing the user to easily visualize two metrics for each location on the map, scale and category.
For example, the following image shows bicycle accident locations in North Carolina. The colour indicates the speed limit of the road the accident occurred on and the size is based on the number of individuals involved in the accident.
Bubble Layer:
Bubble layers are a great way to represent location data as scaled circles on the map.
Allowing the user to easily visualize two metrics for each location on the map, scale and category.
For example, the following image shows bicycle accident locations in North Carolina. The colour indicates the speed limit of the road the accident occurred on and the size is based on the number of individuals involved in the accident.