Author: Prashant Pawar, Cloud Engineer
The ELK Stack — is a collection of open-source software Elasticsearch, Logstash, and Kibana on the server side, along with Filebeat on the client side which allows you to search, analyse, and visualize logs generated from any source in any format, a practice known as centralized logging.
The Elastic Stack has four main components:




 So, by following this process we can install and configure ELK Stack on CentOS.
- Elasticsearch: a distributed RESTful search engine which stores all the collected data.
- Logstash: the data processing component of the Elastic Stack which sends incoming data to Elasticsearch.
- Kibana: a web interface for searching and visualizing logs.
- Beats: lightweight, single-purpose data shippers that can send data from hundreds or thousands of machines to either Logstash or Elasticsearch.
Pre-requisites:
Java 8 — which is required by Elasticsearch and Logstash — installed on your server. We can install Java using following command:
sudo yum install java-11-openjdk-devel
To verify the installation, run the following command which will print the Java version:
java -version
Step 1 — Installing and Configuring Elasticsearch
- Import the Elasticsearch public GPG key to the rpm package manager:
sudo rpm –import https://artifacts.elastic.co/GPG-KEY-elasticsearch
- Insert the following lines to the repository configuration file repo:
sudo nano /etc/yum.repos.d/elasticsearch.repo
Paste the below lines, save and exit the file.
[elasticsearch-7.x]
name=Elasticsearch repository for 7.x packages
baseurl=https://artifacts.elastic.co/packages/7.x/yum
gpgcheck=1
gpgkey=https://artifacts.elastic.co/GPG-KEY-elasticsearch
enabled=1
autorefresh=1
type=rpm-md

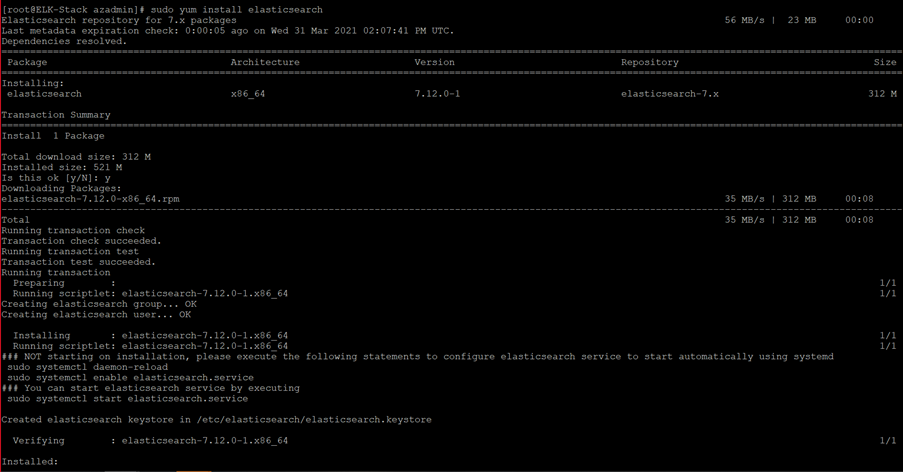
- Install Elasticsearch with the following command:
sudo yum install elasticsearch

- Once Elasticsearch is finished installing, open its main configuration file, elasticsearch.yml, in your editor and make the following changes. Save and exit the file:
sudo nano /etc/elasticsearch/elasticsearch.yml

- Then, start the Elasticsearch service with systemctl:
sudo systemctl start elasticsearch
- Next, run the following command to enable Elasticsearch to start up every time your server boots:
sudo systemctl enable elasticsearch
- You can test whether your Elasticsearch service is running by sending an HTTP request:
curl -X GET "localhost:9200"
- You will see a response showing some basic information about your local node, like this:
Output:
{
"name" : "8oSCBFJ",
"cluster_name" : "elasticsearch",
"cluster_uuid" : "1Nf9ZymBQaOWKpMRBfisog",
"version" : {
"number" : "6.5.2",
"build_flavor" : "default",
"build_type" : "rpm",
"build_hash" : "9434bed",
"build_date" : "2018-11-29T23:58:20.891072Z",
"build_snapshot" : false,
"lucene_version" : "7.5.0",
"minimum_wire_compatibility_version" : "5.6.0",
"minimum_index_compatibility_version" : "5.0.0"
},
"tagline" : "You Know, for Search"
}
Step 2 — Installing and Configuring the Kibana Dashboard
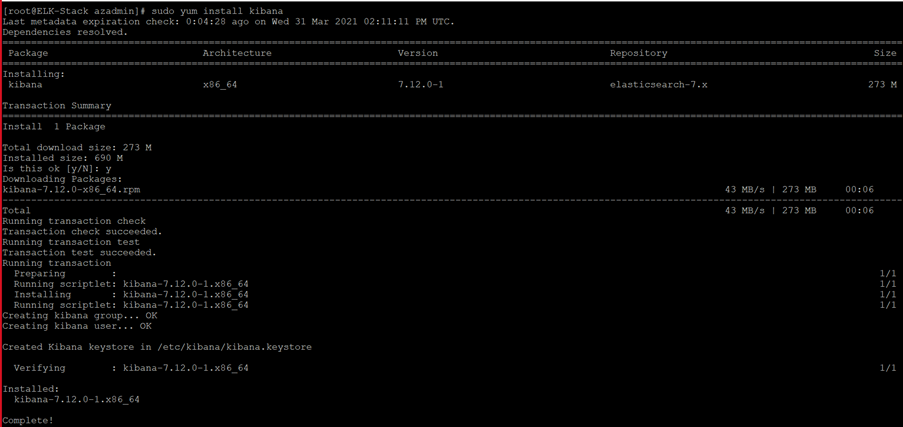
- Because you already added the Elastic repository in the previous step, you can just install the remaining components of the Elastic Stack using yum:
sudo yum install kibana

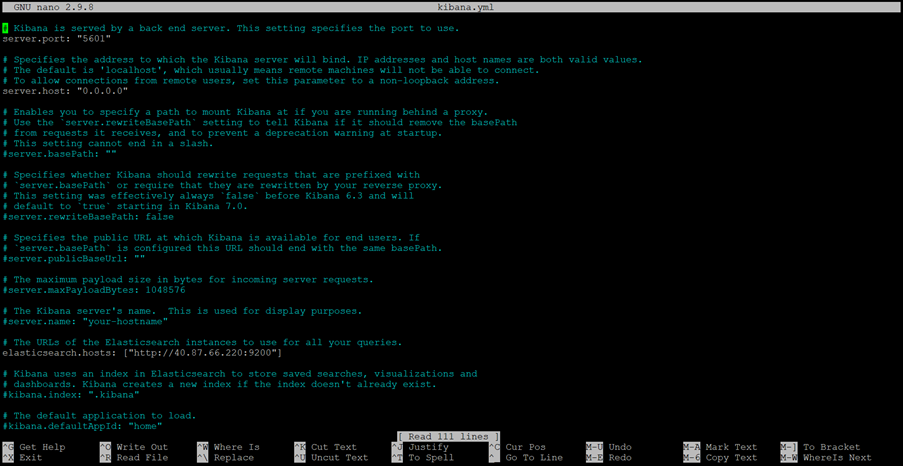
- Once Kibana is finished installing, open its main configuration file, kibana.yml, in your editor and make the following changes. Save and exit the file:
sudo nano /etc/kibana/kibana.yml

- Then enable the Kibana service:
sudo systemctl enable kibana
- Start the Kibana service:
sudo systemctl start kibana
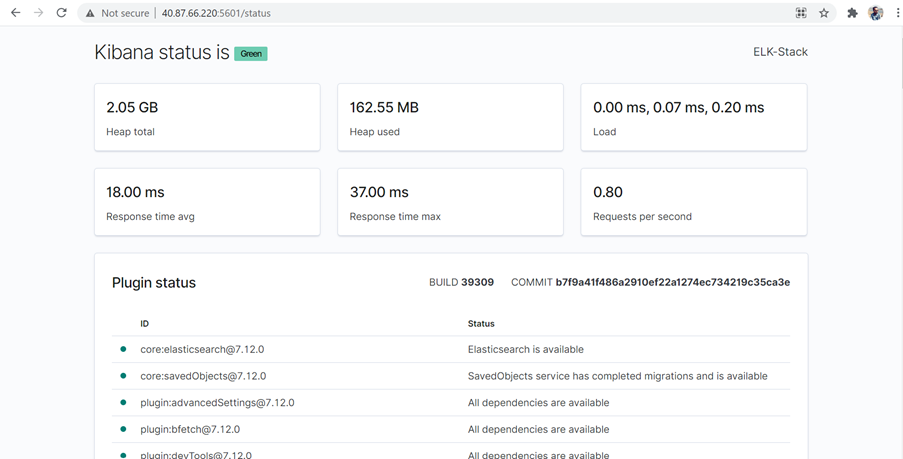
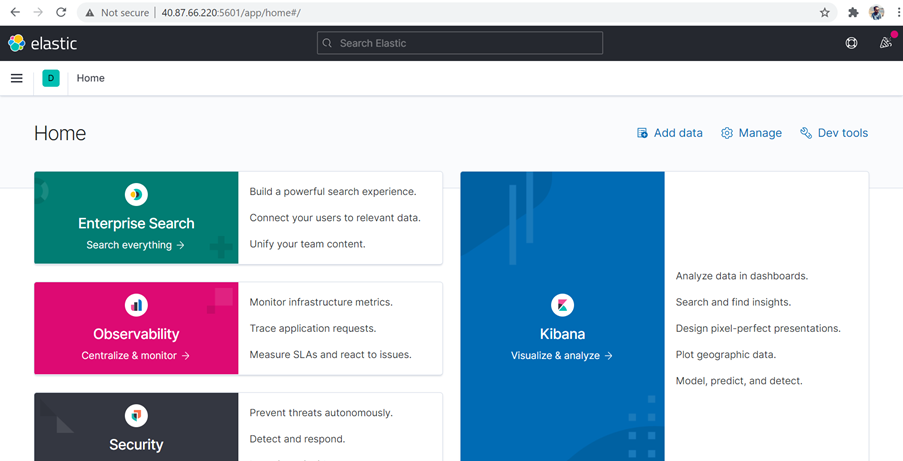
- Kibana is now accessible via your public IP address of your Elastic Stack server. You can check the Kibana server’s status page by navigating to the following address:
http:// your_server_ip/status

- Kibana is accessible via your public IP address of your Elastic Stack server. You can check the Kibana dashboard by navigating to the following address:
http:// your_server_ip:5601

Step 3 — Installing and Configuring Filebeat
- Install Filebeat on all the servers you want to monitor.
- To download and install Filebeat, use the following commands.
curl -L -O https://artifacts.elastic.co/downloads/beats/filebeat/filebeat-7.12.0-x86_64.rpm
sudo rpm -vi filebeat-7.12.0-x86_64.rpm
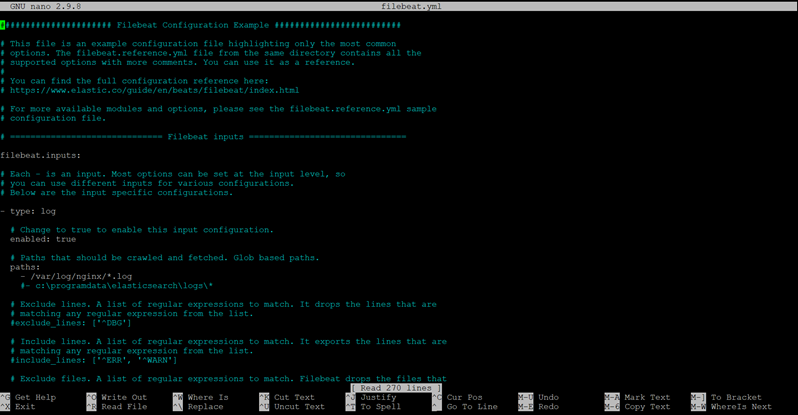
- Once Filebeat is finished installing, open its main configuration file, filebeat.yml, in your editor and make the following changes. Save and exit the file:
sudo nano /etc/filebeat/filebeat.yml


- Enable and configure data collection modules. Identify the modules you need to enable. To see a list of available modules, run:
filebeat modules list
- To enable the System and Nginx module, run the following command:
filebeat modules enable system nginx
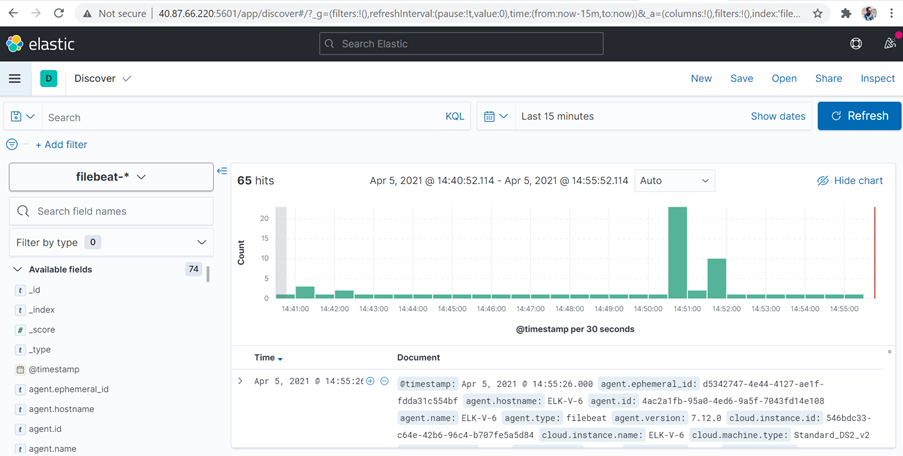
- After some time, Go to the Kibana dashboard and from the menu select Discover:

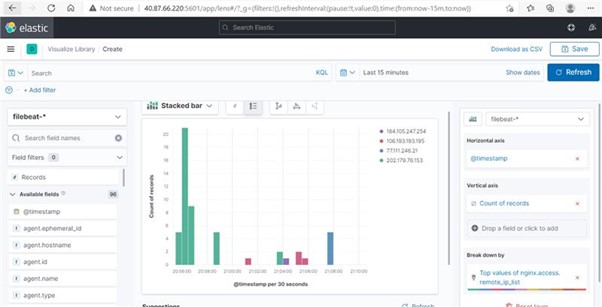
- On the dashboard, we can see the System and Nginx logs:


 So, by following this process we can install and configure ELK Stack on CentOS.


