Author – Mahesh Kumar, Cloud Engineer
Overview
Prometheus and Grafana are open-source monitoring tools which helps to monitor Kubernetes clusters. It allows users and developers to capture metrics and telemetry data for applications running inside the cluster. It allows for deeper insights of your application’s performance and reliability at the container level.Prometheus
Prometheus stores all the data as a time series. This data can be retrieved by PromQL query language and visualized with a built-in expression browser. Prometheus does not provide a dashboard it relies on a visualizing tool to represent the data. It is one of the most used Kubernetes monitoring tools. The Kubernetes ecosystem provides built-in Prometheus adapter that exposes generated metrics and collects the telemetry data.Grafana
Grafana is used to visualize any data. It can be used to create multiple dashboards, or you can use pre-designed dashboards that are provided within Grafana which also supports a variety of beautiful graphs and visualizations for different users and stakeholders. It has support for integration for different types of data sources, which are listed below.- Prometheus
- Azure Monitor
- Google Cloud Monitoring
- AWS CloudWatch
- Elasticsearch
- Graphite
- InfluxDB
- Loki
- Microsoft SQL Server (MSSQL)
- MySQL
- OpenTSDB
- PostgreSQL
Prerequisites
- Azure subscription
- Azure CLI
- Azure Kubernetes cluster
- Helm CLI
Create AKS cluster
Before configuration, we will need an AKS cluster if you don’t have an existing cluster you can use the below command to create a new AKS cluster. Also, you can use the azure portal, but we will use Azure CLI to create cluster.
$ az login
$ az account list -o table
$ az account set –subscription
$ az aks get-credentials -n -g
Once the cluster is setup you need to clone the repository below.
$ git clone https://github.com/maheshkvis/AKS-Monitoring-Tool.git
Installing Prometheus Helm Chart
Run the command below to install Prmetheus helm Chart and be sure to set “rbac.create=true” if RBAC is enabled inside your cluster.
$ cd AKS-Monitoring-ToolPrometheus
$ kubectl create namespace monitoring
$ helm install . –namespace monitoring –set rbac.create=false
$ SVC_IP=$(kubectl get svc –namespace monitoring -l "app=prometheus,component=server" -o jsonpath="{.items[0].spec.clusterIP}")
The $SVP_IP stores your Prometheus server IP we will be using this for configuring Grafana.
Installing Grafana Chart
Run the code below to install Grafana Chart:
$ cd ..grafana
$ grafana_chart=
$ helm install $grafana_chart . –set persistence.enabled=true –set persistence.accessModes={ReadWriteOnce} –set persistence.size=8Gi –namespace monitoring
Run the following command to acess the Grafana Dashboard:
$ kubectl get svc $grafana_chart
OR
$ export POD_NAME=$(kubectl get pods –namespace monitoring -l "app.kubernetes.io/name=grafana,app.kubernetes.io/instance=chart-1599858402" -o jsonpath="{.items[0].metadata.name}")
$ kubectl –namespace monitoring port-forward $POD_NAME 3000
The Grafana dashboard username is admin and for password execute this command.
$ kubectl get secret –namespace monitoring $grafana_chart -o jsonpath="{.data.admin-password}" | base64 –decode ; echo
Steps for setting up Grafana Dashboard
- Login inside the Grafana dashboard and add your data source.

- Select Prometheus as the data source.

- In the URL section add your Prometheus Server Cluster IP.

- Import Dashboard

- Add Dasboard ID

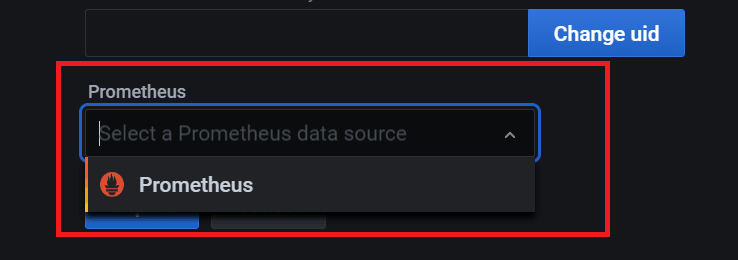
- Select your data source for the dashboard

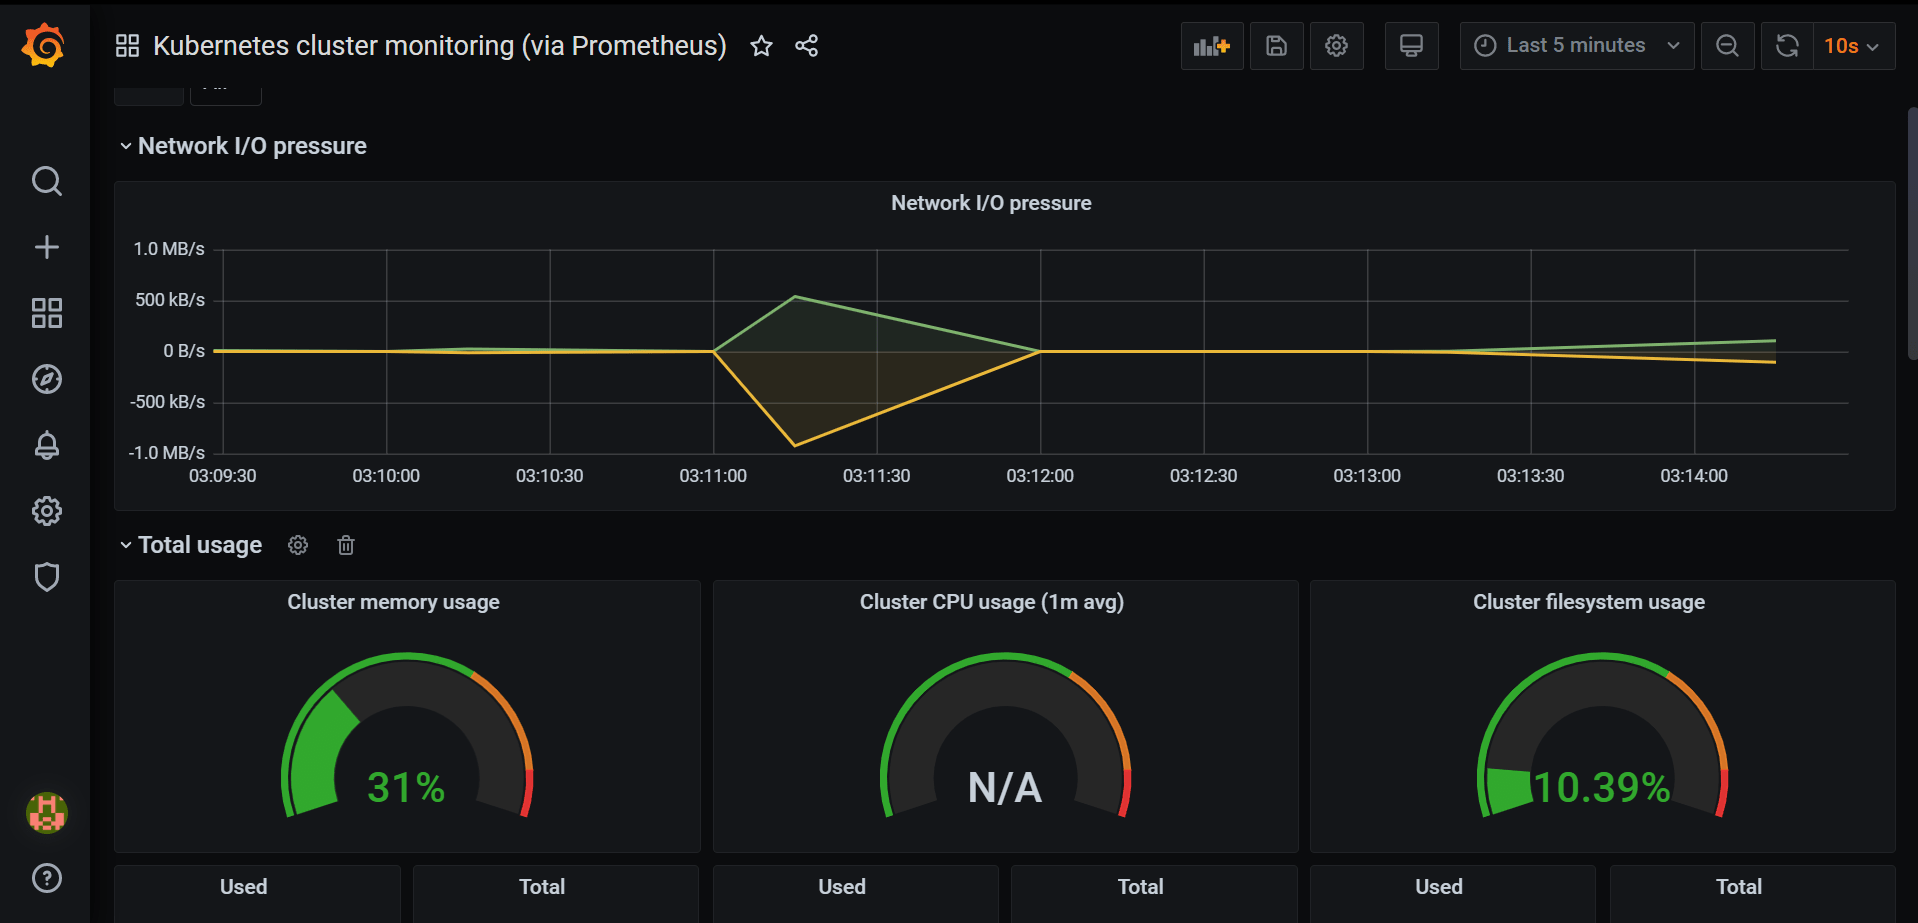
- Your final outcome should look something like this.


