Author – Gunjan Chaudhari, Associate Cloud Engineer
After reading this title I am pretty sure you are confused about what we are going to learn in this blog. But right now, let’s focus on two important words Azure Event Hub and SIEM.
What is Azure Event Hub?
As the name says, it is a service provided by Azure to store events. But this service is much more than that the name says, Azure event hub handles data that is continuously generated from different sources i.e. it is a data streaming platform and event ingestion service, which can process millions of events per second. Due to the low latency, it can handle large distributed streaming capacity in seconds. It comes under Platform as a Service (PaaS) in Azure. It is a fully managed service that is simple and scalable but with little bit more configurations in Azure. For example, Event Hubs enable behavior tracking in mobile apps, traffic information from web farms, in-game event capture in console games, or telemetry collected from industrial machines, connected vehicles, or other devices.
Terminologies:
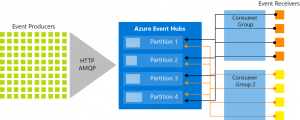
- Event Producers: An entity that sends the messages (events) to the Event hub is known as Event producer or publisher. Event producers/publishers can publish events using HTTPS or AMQP. Using these protocols, an Event Producer can ingest the data in the event hub.
- Partitions: In the event hub, we can have multiple partitions. This multiple partition enables parallel processing of the event. We can create 32 partitions and if users need more partitions, they can contact the Azure team. Each partition has a partition key/id. Partitions are used to segregate the data. The events get stored in the partition in sequence, as the newer events arrive, they are added to the end of the sequence.
- Consumer Groups: It is a view of the entire event hub. Consumer groups enable consuming applications to have a separate view of the event stream. In the real-world scenario, if you have a partition full of events generally you will have two applications that are reading those events within that partition. One application typically reads the events and puts them into storage, because the event in the event hub will be expired in a certain period and another application is used to read the events and to identify some issues. Both applications will have different offset keys. An offset is a position of an event within the partition. It is basically a curser and this curser value needs to be stored by each application. So, they will know where they need to start reading again.
- Throughput unit: It is a unit of the capacity to handle the traffic coming and going out through the event hub.
- Event Receivers: An entity that receives/reads the event data from the event hub is known as an event receiver.
What is SIEM Tool?
Security Information and Event Management (SIEM) is a software that collects security data from various sources like applications, domain controllers, servers, and many more. This collected data is normalized and aggregated for analyzing the data to discover and detect threats and notifying the administrator using alerts. SIEM is important because it makes it easy for enterprises to filter the massive amount of data and set security alerts as per the organization. For instance, a user account that generates 25 failed login attempts in 25 minutes could be flagged as suspicious but still be set at a lower priority because the login attempts were probably made by the user who had probably forgotten his login information. However, a user account that generates 130 failed login attempts in five minutes would be flagged as a high-priority event because it’s most likely a brute-force attack in progress. Popular SIEM Tools are Splunk, IBM QRadar, Log Rhythm.
The main challenge was that we were not able to see IIS logs. To see all the logs, we used the SIEM tool. Another difficulty we faced was connecting EventHub with the virtual machine and storage account. This was solved by using a diagnostic script which is mentioned below.
Demo:
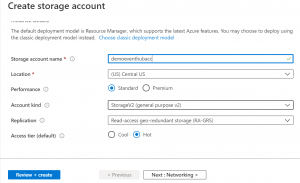
Step 1: Create a storage account to create one container inside it to store all the logs.
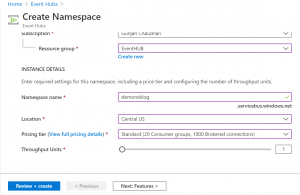
Step 2: Create Event hub namespace in the Azure portal. While creating this keep the pricing tier as Standard so that we can create multiple consumer groups if needed. After this, Click on Review + create.
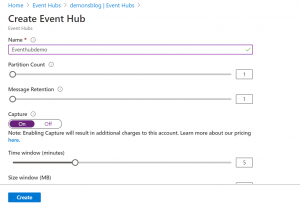
Step 3: Create an event hub inside the namespace which we created and enable the capture option. Select the storage account and container which we created to store logs.
Step 4: After creating EventHub and namespace, we need to make changes in the script. This script is used so that we can get diagnostics of the virtual machine.
- Replace your Subscription ID, resource group name, and VM name or you can directly go into the virtual machine’s properties and copy-paste resource ID in the script.
<Metrics resourceId=“/subscriptions/SubscriptionID/resourceGroups/resourceGroupName/providers/Microsoft.Compute/virtualMachines/VM name“>
- Replace EventHubNamespace name and event hub name.
<EventHub Url=“https://EventHubNamespaceName.servicebus.windows.net/EventHubName“ SharedAccessKeyName=“RootManageSharedAccessKey“ />
- Replace the Storage account name and storage account key
<StorageAccount name=“Storage Account Name” key=”StorageAccount Key“ />
- Replace EventHubNamespace name and event hub name in a Private config tag.
<PrivateConfig>
<StorageAccount name=“Storage Account Name” key=”StorageAccount Key“ />
<EventHub Url=“https://EventHubNamespaceName.servicebus.windows.net/EventHubName“
SharedAccessKeyName=“RootManageSharedAccessKey“
SharedAccessKey= “Primary key of RootManageSharedAccessKey”/>
</PrivateConfig>
After all the changes the code will look like this :
<?xml version="1.0" encoding="utf-8"?>
DiagnosticsConfiguration xmlns="http://schemas.microsoft.com/ServiceHosting/2010/10/DiagnosticsConfiguration">
<PublicConfig>
<WadCfg>
<DiagnosticMonitorConfiguration overallQuotaInMB="4096">
<DiagnosticInfrastructureLogs scheduledTransferLogLevelFilter="Error"/>
<PerformanceCounters scheduledTransferPeriod="PT1M" sinks="HotPath">
<PerformanceCounterConfiguration counterSpecifier="\Processor(_Total)\% Processor Time" sampleRate="PT15S" unit="Percent">
<annotation displayName="CPU utilization" locale="en-us"/>
</PerformanceCounterConfiguration>
<PerformanceCounterConfiguration counterSpecifier="\Processor(_Total)\% Privileged Time" sampleRate="PT15S" unit="Percent">
<annotation displayName="CPU privileged time" locale="en-us"/>
</PerformanceCounterConfiguration>
<PerformanceCounterConfiguration counterSpecifier="\Processor(_Total)\% User Time" sampleRate="PT15S" unit="Percent">
<annotation displayName="CPU user time" locale="en-us"/>
</PerformanceCounterConfiguration>
<PerformanceCounterConfiguration counterSpecifier="\Processor Information(_Total)\Processor Frequency" sampleRate="PT15S" unit="Count">
<annotation displayName="CPU frequency" locale="en-us"/>
</PerformanceCounterConfiguration>
<PerformanceCounterConfiguration counterSpecifier="\System\Processes" sampleRate="PT15S" unit="Count">
<annotation displayName="Processes" locale="en-us"/>
</PerformanceCounterConfiguration>
<PerformanceCounterConfiguration counterSpecifier="\Process(_Total)\Thread Count" sampleRate="PT15S" unit="Count">
<annotation displayName="Threads" locale="en-us"/>
</PerformanceCounterConfiguration>
<PerformanceCounterConfiguration counterSpecifier="\PhysicalDisk(0 C:)\Disk Transfers/sec" sampleRate="PT1M" unit="Count">
<annotation displayName="C: Drive (OS disk) IOPS" locale="en-us"/>
</PerformanceCounterConfiguration>
<PerformanceCounterConfiguration counterSpecifier="\Process(_Total)\Handle Count" sampleRate="PT15S" unit="Count">
<annotation displayName="Handles" locale="en-us"/>
</PerformanceCounterConfiguration>
<PerformanceCounterConfiguration counterSpecifier="\Memory\% Committed Bytes In Use" sampleRate="PT15S" unit="Percent">
<annotation displayName="Memory usage" locale="en-us"/>
</PerformanceCounterConfiguration>
<PerformanceCounterConfiguration counterSpecifier="\Memory\Available Bytes" sampleRate="PT15S" unit="Bytes">
<annotation displayName="Memory available" locale="en-us"/>
</PerformanceCounterConfiguration>
<PerformanceCounterConfiguration counterSpecifier="\Memory\Committed Bytes" sampleRate="PT15S" unit="Bytes">
<annotation displayName="Memory committed" locale="en-us"/>
</PerformanceCounterConfiguration>
<PerformanceCounterConfiguration counterSpecifier="\Memory\Commit Limit" sampleRate="PT15S" unit="Bytes">
<annotation displayName="Memory commit limit" locale="en-us"/>
</PerformanceCounterConfiguration>
<PerformanceCounterConfiguration counterSpecifier="\Memory\Pool Paged Bytes" sampleRate="PT15S" unit="Bytes">
<annotation displayName="Memory paged pool" locale="en-us"/>
</PerformanceCounterConfiguration>
<PerformanceCounterConfiguration counterSpecifier="\Memory\Pool Nonpaged Bytes" sampleRate="PT15S" unit="Bytes">
<annotation displayName="Memory non-paged pool" locale="en-us"/>
</PerformanceCounterConfiguration>
<PerformanceCounterConfiguration counterSpecifier="\PhysicalDisk(_Total)\% Disk Time" sampleRate="PT15S" unit="Percent">
<annotation displayName="Disk active time" locale="en-us"/>
</PerformanceCounterConfiguration>
<PerformanceCounterConfiguration counterSpecifier="\PhysicalDisk(_Total)\% Disk Read Time" sampleRate="PT15S" unit="Percent">
<annotation displayName="Disk active read time" locale="en-us"/>
</PerformanceCounterConfiguration>
<PerformanceCounterConfiguration counterSpecifier="\PhysicalDisk(_Total)\% Disk Write Time" sampleRate="PT15S" unit="Percent">
<annotation displayName="Disk active write time" locale="en-us"/>
</PerformanceCounterConfiguration>
<PerformanceCounterConfiguration counterSpecifier="\PhysicalDisk(_Total)\Disk Transfers/sec" sampleRate="PT15S" unit="CountPerSecond">
<annotation displayName="Disk operations" locale="en-us"/>
</PerformanceCounterConfiguration>
<PerformanceCounterConfiguration counterSpecifier="\PhysicalDisk(_Total)\Disk Reads/sec" sampleRate="PT15S" unit="CountPerSecond">
<annotation displayName="Disk read operations" locale="en-us"/>
</PerformanceCounterConfiguration>
<PerformanceCounterConfiguration counterSpecifier="\PhysicalDisk(_Total)\Disk Writes/sec" sampleRate="PT15S" unit="CountPerSecond">
<annotation displayName="Disk write operations" locale="en-us"/>
</PerformanceCounterConfiguration>
<PerformanceCounterConfiguration counterSpecifier="\PhysicalDisk(_Total)\Disk Bytes/sec" sampleRate="PT15S" unit="BytesPerSecond">
<annotation displayName="Disk speed" locale="en-us"/>
</PerformanceCounterConfiguration>
<PerformanceCounterConfiguration counterSpecifier="\PhysicalDisk(_Total)\Disk Read Bytes/sec" sampleRate="PT15S" unit="BytesPerSecond">
<annotation displayName="Disk read speed" locale="en-us"/>
</PerformanceCounterConfiguration>
<PerformanceCounterConfiguration counterSpecifier="\PhysicalDisk(_Total)\Disk Write Bytes/sec" sampleRate="PT15S" unit="BytesPerSecond">
<annotation displayName="Disk write speed" locale="en-us"/>
</PerformanceCounterConfiguration>
<PerformanceCounterConfiguration counterSpecifier="\PhysicalDisk(_Total)\Avg. Disk Queue Length" sampleRate="PT15S" unit="Count">
<annotation displayName="Disk average queue length" locale="en-us"/>
</PerformanceCounterConfiguration>
<PerformanceCounterConfiguration counterSpecifier="\PhysicalDisk(_Total)\Avg. Disk Read Queue Length" sampleRate="PT15S" unit="Count">
<annotation displayName="Disk average read queue length" locale="en-us"/>
</PerformanceCounterConfiguration>
<PerformanceCounterConfiguration counterSpecifier="\PhysicalDisk(_Total)\Avg. Disk Write Queue Length" sampleRate="PT15S" unit="Count">
<annotation displayName="Disk average write queue length" locale="en-us"/>
</PerformanceCounterConfiguration>
<PerformanceCounterConfiguration counterSpecifier="\LogicalDisk(_Total)\% Free Space" sampleRate="PT15S" unit="Percent">
<annotation displayName="Disk free space (percentage)" locale="en-us"/>
</PerformanceCounterConfiguration>
<PerformanceCounterConfiguration counterSpecifier="\LogicalDisk(_Total)\Free Megabytes" sampleRate="PT15S" unit="Count">
<annotation displayName="Disk free space (MB)" locale="en-us"/>
</PerformanceCounterConfiguration>
</PerformanceCounters>
<Metrics resourceId="/subscriptions/SubscriptionID/resourceGroups/EventHUB /providers/Microsoft.Compute/virtualMachines/VMe">
<MetricAggregation scheduledTransferPeriod="PT1H"/>
<MetricAggregation scheduledTransferPeriod="PT1M"/>
</Metrics>
<WindowsEventLog scheduledTransferPeriod="PT1M">
<DataSource name="Application!*[System[(Level = 1 or Level = 2)]]"/>
<DataSource name="Security!*[System[(Level = 1 or Level = 2)]"/>
<DataSource name="System!*[System[(Level = 1 or Level = 2)]]"/>
</WindowsEventLog>
</DiagnosticMonitorConfiguration>
<SinksConfig>
<Sink name="HotPath">
<span style="color: #000000"><EventHub Url="https://demonsblog.servicebus.windows.net/eventhubdemo" SharedAccessKeyName="RootManageSharedAccessKey" /></span>
</Sink>
</SinksConfig>
</WadCfg>
<StorageAccount name="demoeventhubacc" key="NybMMmmGD3LFZGtrPXmq64kb/iGQuoNmblWoo53CCJCyVvuMlh6LH3fkHq8PvA/9Amk1ZKQ5aV91L
Qova4WKjA==" />
</PublicConfig>
<PrivateConfig>
<StorageAccount name="demoeventhubacc" key="NybMMmmGD3LFZGtrPXmq64kb/iGQuoNmblWoo53CCJCyVvuMlh6LH3fkHq8PvA/9Amk1ZKQ5aV91L
Qova4WKjA==" />
<EventHub Url="https://demonsblog.servicebus.windows.net/eventhubdemo" SharedAccessKeyName="RootManageSharedAccessKey" SharedAccessKey="vQw3GAsvKNZmn8MznOZ/OF68bUiqr3mCSOitoF9YKCo=" />
</PrivateConfig>
<IsEnabled>true</IsEnabled>
</DiagnosticsConfiguration>
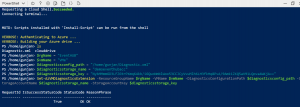
Step 5: Save this document with .xml extension. For eg: Diagnostic.xml and open the PowerShell to create a diagnostic extension for Virtual machine.
Connect-AzAccount
$rgName = “[Resource Group Name]”
$vmName = “[VM name]”
$diagnosticsconfig_path = “[Diagnostic file local path eg: C:\Users\Gunjan\Desktop\Diagnostic.xml]”
$diagnosticsstorage_name = “[storage Name]”
$diagnosticsstorage_key = “[Storage Key]”
Set-AzVMDiagnosticsExtension –ResourceGroupName $rgName –VMName $vmName –DiagnosticsConfigurationPath $diagnosticsconfig_path –StorageAccountName $diagnosticsstorage_name –StorageAccountKey $diagnosticsstorage_key
We have successfully created a diagnostic extension for our Virtual Machine. We can see the logs in our storage account by clicking on Tables. We can also use a third-party tool such as Azure Service Bus explorer for receiving the logs.
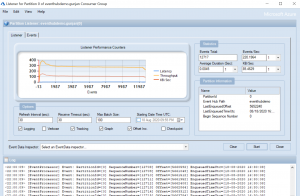
Step 6: Install Service Bus explorer and connect it with Event Hub Namespace by using a connection string. We can get this connection string in the shared access policies of Event Hub Namespace.
For eg:
Endpoint=sb://demonsblog.servicebus.windows.net/;
SharedAccessKeyName=RootManageSharedAccessKey;
SharedAccessKey=vQw3GAsvKNZmn8MznOZ/OF68bUiqr3mCSOitoF9YKCo=
Step 7: After connecting our Service Bus Explorer with Azure Event Hub we can receive logs by creating a consumer group and then right-click on that consumer group to create a consumer group listener.
Voilà!!
We have successfully implemented Azure Event Hub and Service Bus Explorer. But before rushing towards closing this blog lets read some benefits of azure event hub.
Benefits:
- Shortens the time taken to notify and for the identification of threats.
- Offers a holistic view of an organization’s information security environment, making it easier to gather and analyze security information to keep systems safe. The organization’s data goes into a centralized repository where it is stored and easily accessible.
- IT team has a choice of frameworks to implement the Azure Event Hub- .NET, JAVA, Python, Nods.js, Apache Storm, etc.
- Can perform detailed forensic analysis in the event of major security breaches


