Author – Varun Raval, Cloud Engineer Intern
If you’ve been searching for a simple way to gain insights into your incidents, entities and data, then this is the Workbook for you. One can investigate incidents efficiently, gain insights into alerts and entities with ease, and pivot through your data while retaining the ability to broadly search with a single click of your mouse.
Note: this article focuses on how to start using the Investigation Insights Workbook.
Once you load Investigation Insights workbook, you’ll see several options at the top – Investigate By and Show Incident Trend.
Let’s start by choosing Incident and Yes, respectively. This brings up helpful Incident Trending information at a Glance. For clarity and from the start, there are two ways to use Investigation Insights: Incident Insights and Entity Insights. Incident Insights is the easiest way to get to you data and is where most people will start from. Entity Insights allows you to do the exact same investigation; however, note as you haven’t selected incident information, you may have to enter some details manually.
The figure below shows Trending data according to the TimeRange you’ve chosen to work in. It shows an average count of severity according to the selected TimeRange.
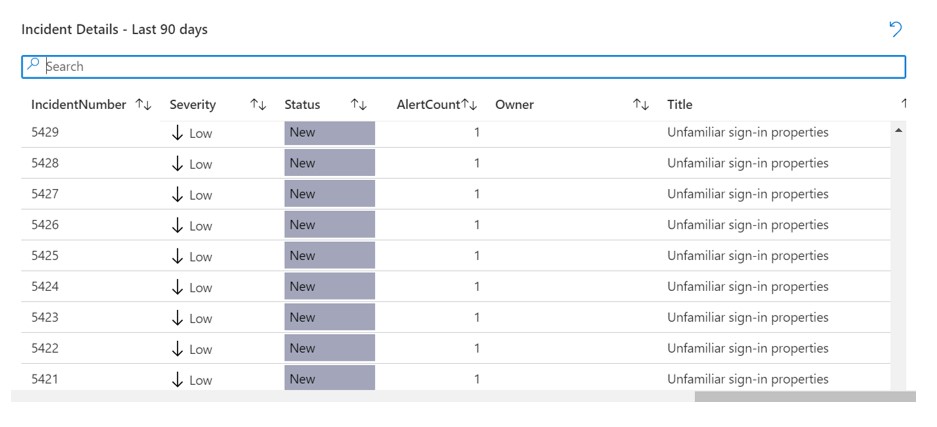
Below Incident Trending is the Incident Investigation Section. This section provides an easily investigating incidents without having to go hunting for data. You can start by viewing all of the incidents in your TimeRange, or you can narrow by using the TimeRange element.
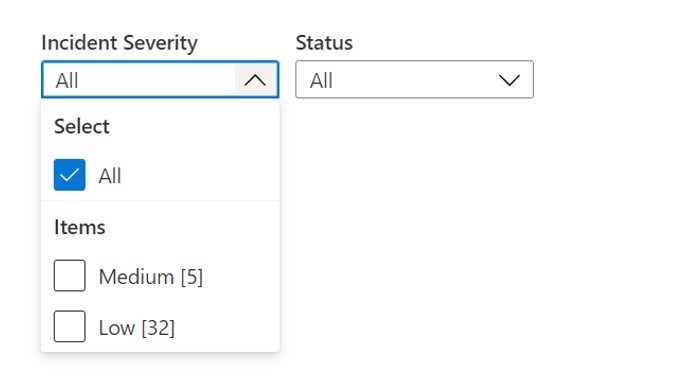
Once you’ve narrowed your time scope, you’ll next want to filter by incident severity.
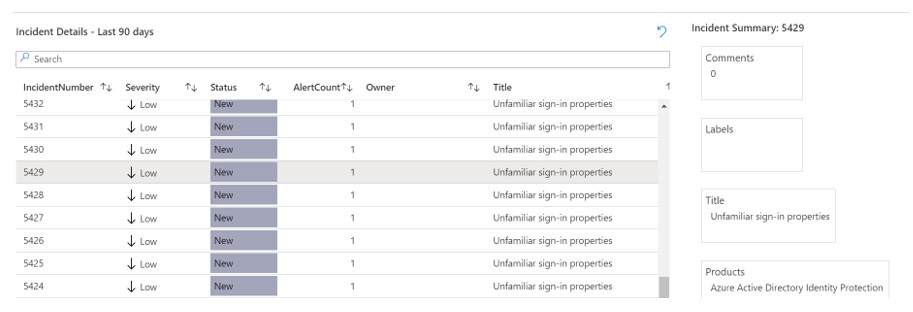
For a bird’s eye view of the data set and environment, it can be useful to start with Show All and then drill down from there. One can click on the Incident or I can type an incident number that they want to research into the Search bar.
Without routing away, one can also easily drill down and research the constituent Alerts within the Incident. Already populated are alert attributes such as the contributing product and the Provider Name.
Clicking on the example alert from Incident also expands the Entities that the Alert contains. This information can be critical to researching the Alert and, in turn, the Incident.
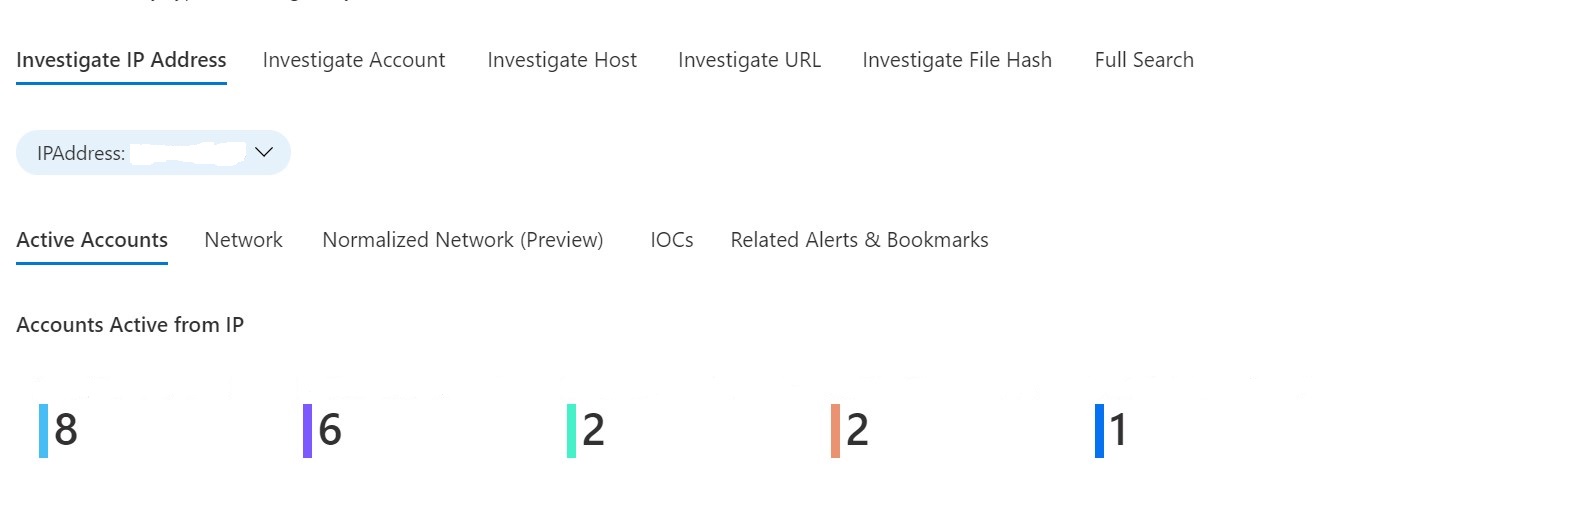
If you’re coming to Entity Insights from an Incident investigation, chances are that you have discovered a specific Entity in an Alert that you’d like to investigate. In this case, you can start your Entity Investigation by clicking on the entity. For example, if we click on the IP address Entity, in order to populate it in the appropriate Entity Insights search:
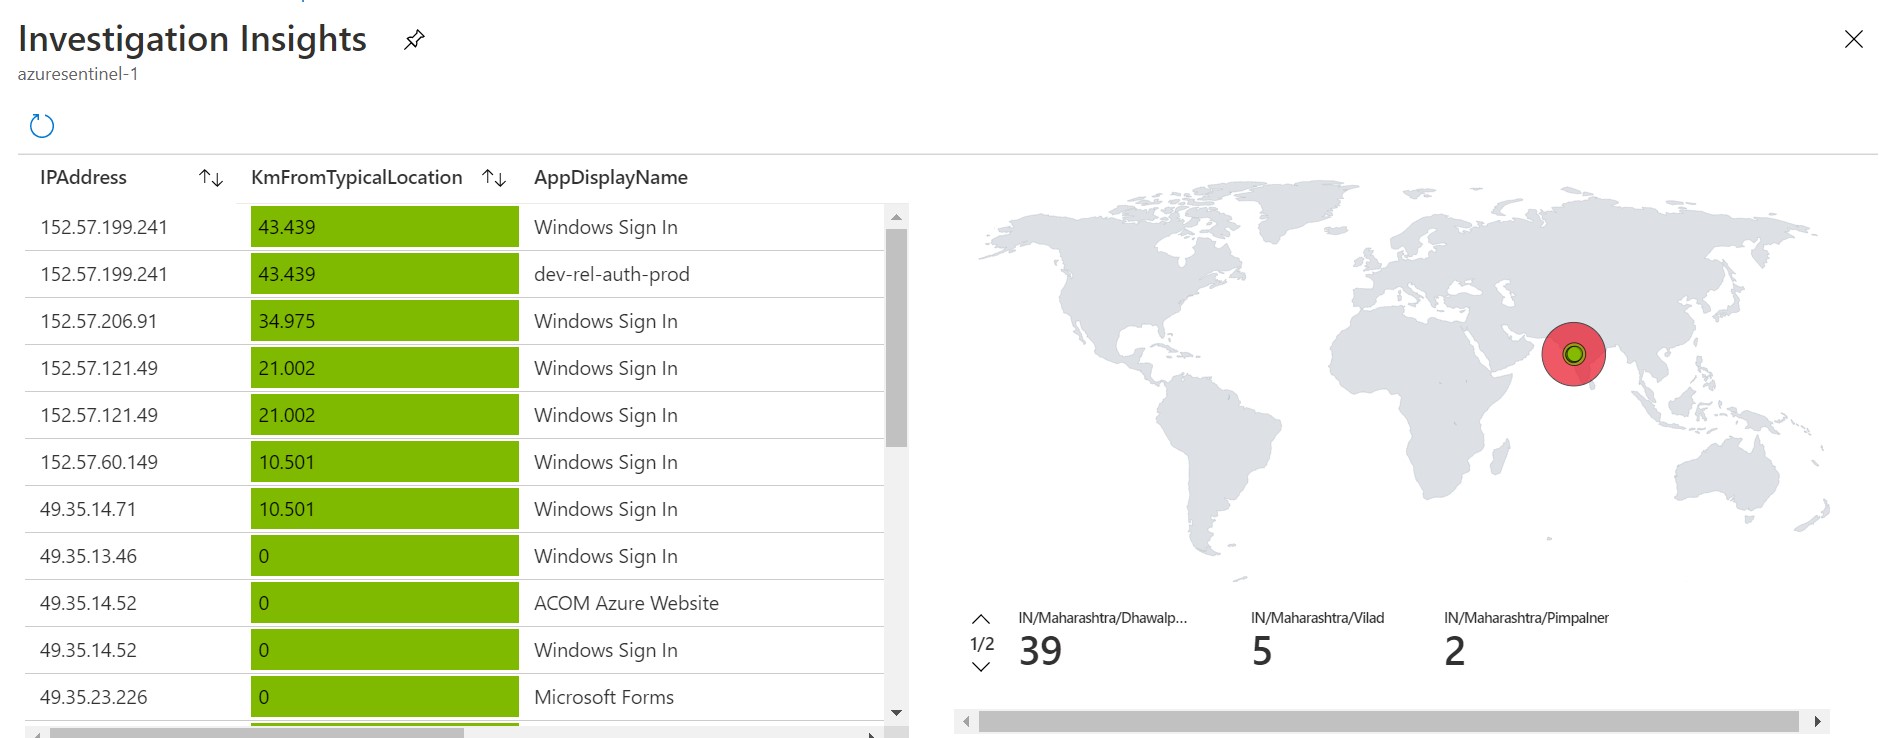
Alternately, one can simply type the entity in the search box of the appropriate type. For example, we click on Investigate Account and type in an account name. This immediately populates a calculated Distance from Typical Singin Location with a map plotting the data. Clicking on a signin produces a detailed chart of the data, including Conditional Access Status. One can also navigate to other tabs to view a Computer Logons table for the account:
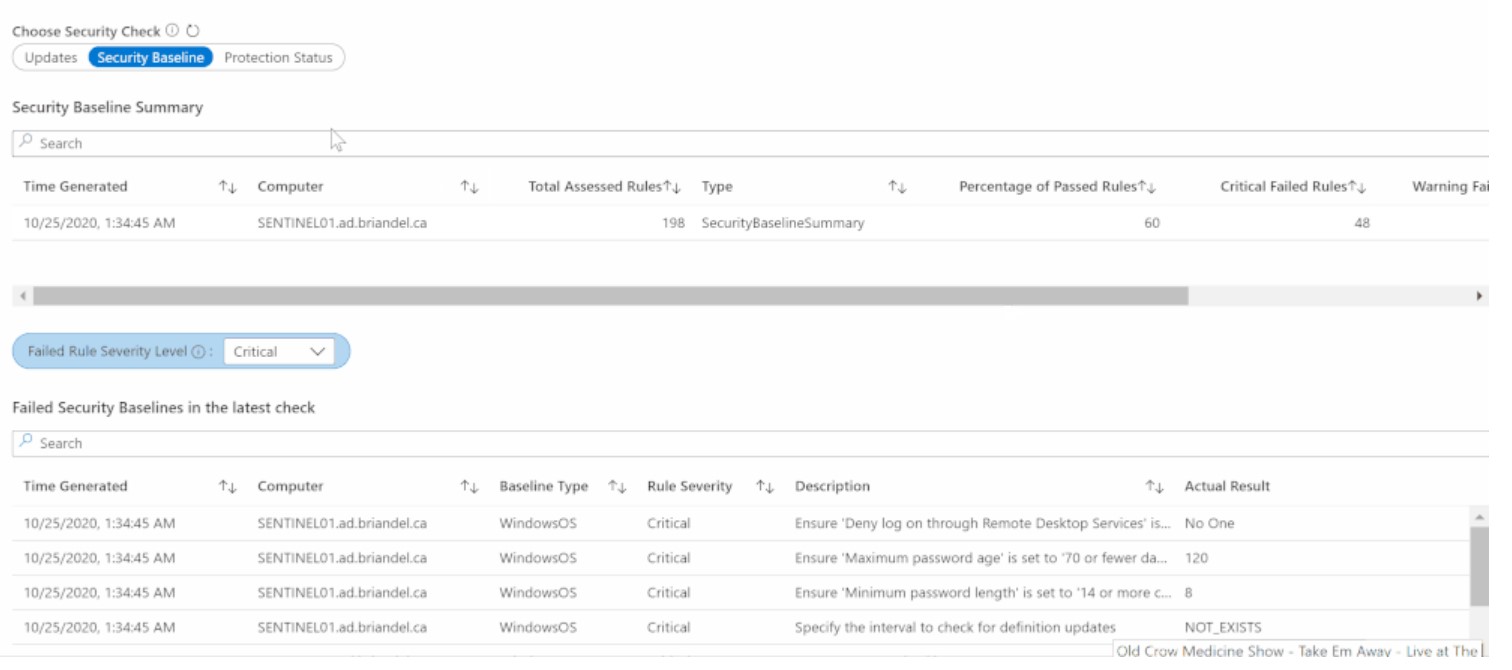
Entity Insights can help in researching Host Entity types, too. By populating the FQDN of a host, one can view New Processes on the host as well as Account Logons and Related alerts. The Suspicious Changes tab displays three sub-sections that may well comprise indicators of compromise. AuditPolChange displays filterable audit policy changes on the host; SecLogClear details any times that the host’s security log was cleared, and User/Group Changes details Account Creations and Group Changes that have taken place.
Finally, don’t forget to check out the Full Search functionality; this tab provides the ability to perform a String type search across all categories of Entity data in your data set, and then to drill deeper by category. This functionality can be deceptively complex and useful. By simply typing in an Entity string suspect might be in the log data, one can search across multiple categories to both view results and to understand quickly where one should look for more data.


